 Click to enlarge image.
The key to understanding a protein structure is to fully evaluate the underlying crystallographic information contained within a PDB file. For example it is important to understand the full biological unit of a protein to identify if crystal-crystal contacts have influenced the structure. See below for a list of key crystallographic analysis features. Return to Main ICM-Pro Page
| Crystallographic Neighbor |
| Molecular objects and 3D density maps may contain information about crystallographic symmetry. It consists of the following parameters: (1.) Crystallographic group eg. P2121 that determine N (depends on a group) transformations for the atoms in the asymetric unit.(2.) Crystallographic cell parameters A, B, C, Alpha, Beta and Gamma To generate the coordinates within one cell one needs to apply N transformations and then to generate neigboring cells the content of one cell needs to be translated in space according to the cell position. ICM has a function which generates crystallographic neighbors for the selected atoms. For large proteins it is impractical to generate neighbors for the whole molecule due to the high number of atoms in all neighboring molecules. |
| Determine symmetry neighbors for a selection or complete PDB file. |
| Define a radius around the selection from which you wish to construct symmetry related molecules. |
| Append symmetry related molecules to one another. |
| Display fragments of symmetry related molecules. |
| Color individual symmetry related molecules a unique color. |
| Crystallographic Cell |
| The crystal structure of a protein is often discussed in terms of its unit cell. The unit cell is a box containing one or more motifs, a spatial arrangement of atoms. The units cells are tiled in three-dimensional space to describe the crystal. The unit cell is given by its lattice parameters, the length of the cell edges and the angles between them, while the positions of the atoms inside the unit cell are described by the set of atomic positions measured from a lattice point. |
| Biomolecule Generator |
| It is very useful to know how a protein from the PDB may look in a biological environment. The PDB entries solved by X-ray crystallography and deposited in the PDB contain the information about the crystal structure rather than the biologically relevant structure. For example, for a viral capsid only one instance of capsid protein complex will be deposited and only one or two molecules of haemoglobin that is a tetramer in solution maybe deposited. In some other cases the asymetric unit may contain more than one copy of a biologically monomeric protein. ICM reads the biological unit information and has a tool to generate a biological unit. Not every PDB entry has the biological unit information. |
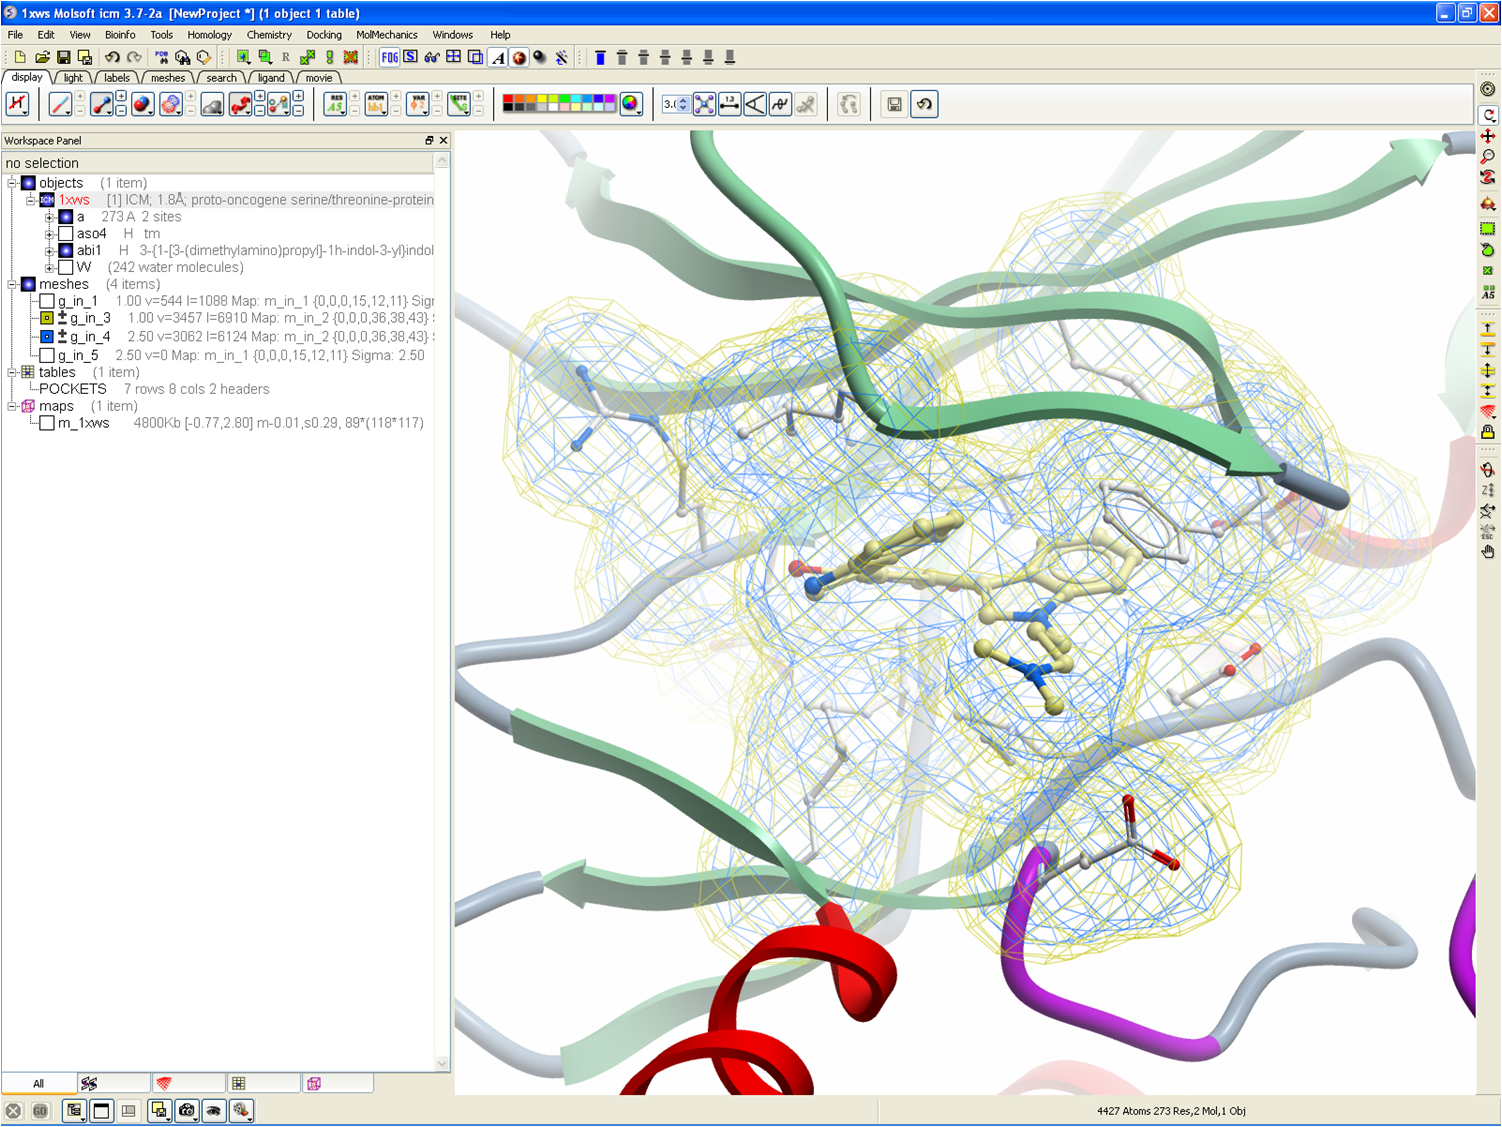
| Elecron Density Maps |
| An electron density map is a representation of a crystal structure based on the diffraction data. The map is constructed by a summation of waves of known phase, amplitude and frequency using Fourier transform. The electron density map of a protein can be viewed along with the pdb structure. The easiest way to view the electron density map is to contour and convert it into a graphical object (mesh). |
| Direct link to the Uppsala Electron Density Server |
| Contour electron density map. |
| Contour electron density map according to selection at atom, residue, molecule or object level. |
| Define sigma level for display, interactively adjust sigma level and display. |
| Color contours according to sigma level. |
| Display the original crystallographic cell of an electron density map. |
| Convert electron density map to grid energy map for real space refinement. |
© 2026 All Rights Reserved MolSoft LLC Terms of Use | Privacy Policy


