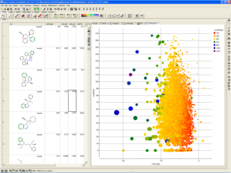
Plot chemical data in interactive plots and histograms.
 Click to enlarge image.
- Histograms and X-Y scatter plots.
- Zoom in/out on one or both dimensions.
- Many plot customizing features including, mark size and shape, string labels, coloring,
least square fitting line...
- Represent up to five dimensions of data using X-Y-color-size-shape.
- Selections made in plots are linked to the spreadsheet.
- Print plots.
Return to ICM-Chemist Main Page