
|
Substrate Specificity In Human Monomeric Carbonyl Reductases - Pilka et al .
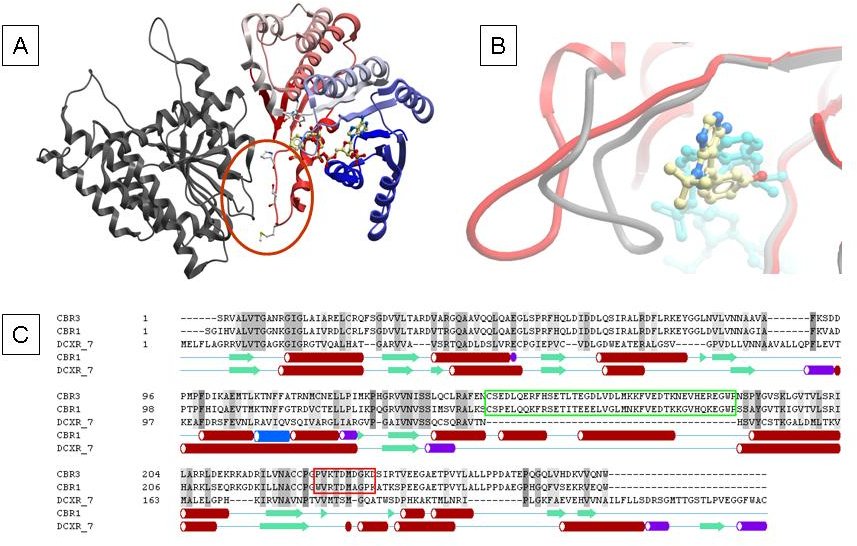
Figure 1: Structure of human CBR3. Panel A: The substrate binding loop in CBR3 is engaged in contacts to a symmetry related copy (red circle), resulting in an open conformation of the active site. Panel B: Comparison of active site configurations of human CBR enzymes. The overlay of the complex structure of human CBR1 (1wma, in grey) with cofactor (magenta) and inhibitor (ball and stick model) with the binary complex of human CBR3 with NADP (2hrb, in red) shows the open and closed active site loop conformations. Panel C: Sequence alignment of human carbonyl reductases CBR1, CBR3 and dicarbonyl reductase DCXR. The 2-helical insertion found in CBR enzymes is highlighted by green boxing, the active site loop region discussed in this paper is highlighted by a red box. Secondary structure elements are shown for CBR1 and DCXR below the alignment.
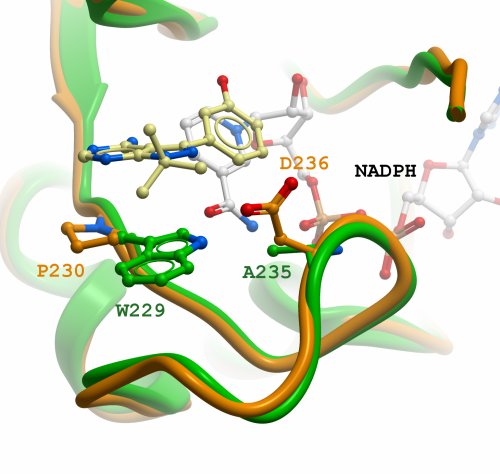
Figure 2: Modelled loop in CBR3 (orange) and comparison to CBR1 (green). Positions and residues used for mutagenesis are highlighted by inclusion of their side-chains. Inhibitor and cofactor from CBR1 (PDB id 1wma) are included.
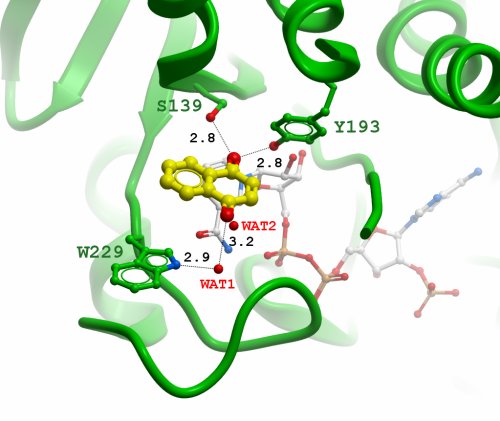
Figure 3:Active site of human CBR1 with 1,4-naphthoquinone docked into a catalytically competent orientation (the water molecules WAT1 and WAT2 were present in the crystl structure of CBR1, but were not used in the docking). The catalytic residues Ser139 and Tyr194 orient the substrate carbonyl, whereas residue Trp229 makes aromatic-stacking interactions and coordination of a water molecule (WAT1) through the indole nitrogen. As a result, the water WAT1 is positioned to form hydrogen bond with the carbonyl group in position to the substrate carbonyl. Note the crystallographic water molecule WAT2 found in the same position as the carbonyl oxygen from the docked substrate. Distances are shown in Å.
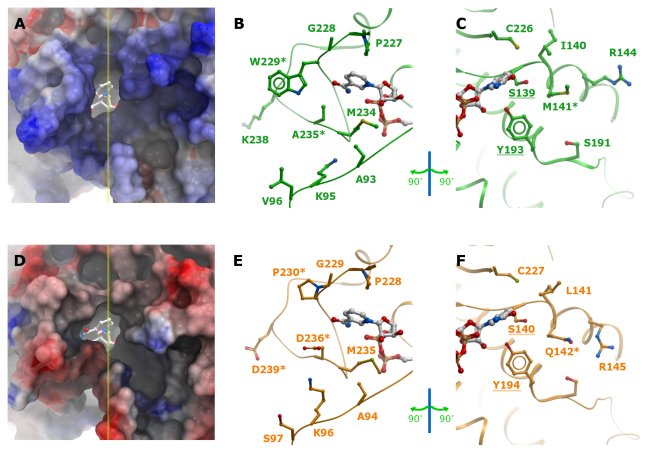
Figure 4:Comparison of active site properties of human CBR1 and CBR3. A-C: CBR1 (green), D-E: CBR3, with modelled loop (orange). First Column (A and D): solvent accessible surface representation of the active site pockets coloured according to electrostatic potentials, with the cofactor represented as sticks. Yellow line marks the plane cutting through the active site. The plane divides the pocket into two halves that are depicted in the following two columns. Second column (B and E): 'left' half of the pocket. Third column (C and F): 'right' half of the pocket. Cofactor is shown for orientation purpose. Residues that were mutated in this study are marked with asterisks. Catalytic residue labels are underlined.
Download Standalone iSee datapack: You can download and view all the Information of a datapack offline including information not available in the web version (where applicable). You will also need to download and install the ICM-Browser to view the standalone datapacks.


Datapack created using Molsoft ICM and Molsoft Browser technologies. (Patent Pending)