The Human Cyclophilin Family of Peptidyl-Prolyl Isomerases - Davis et al.

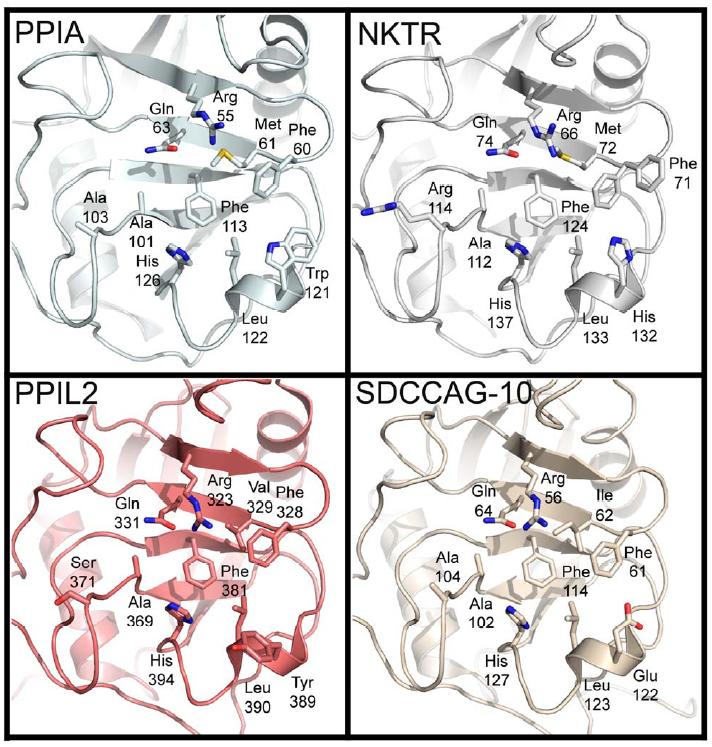
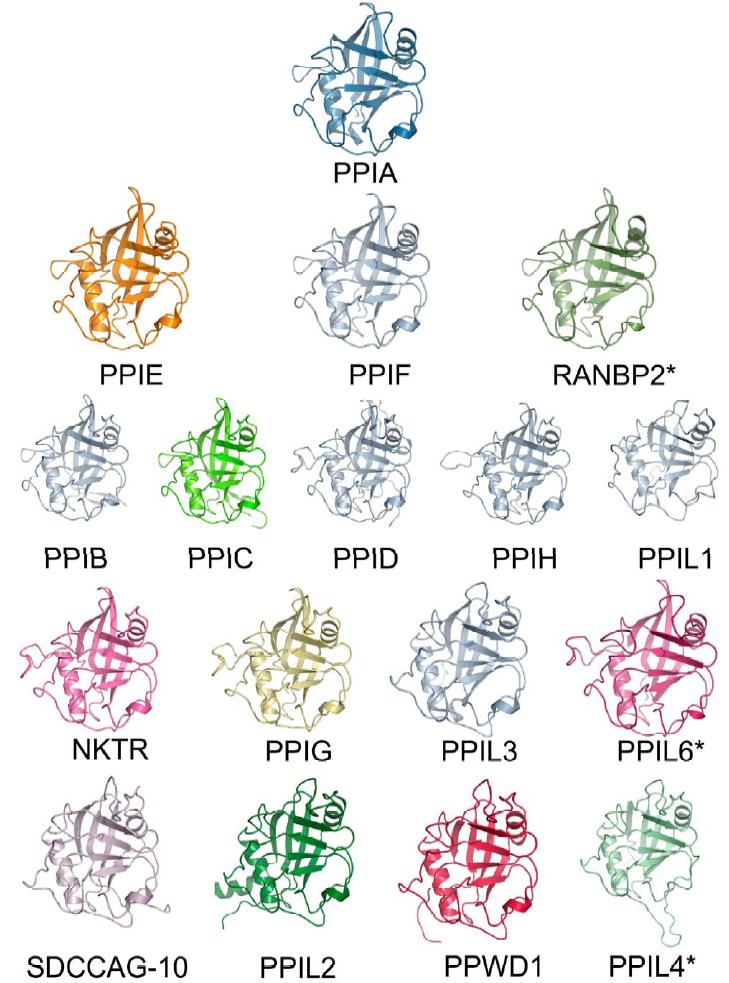
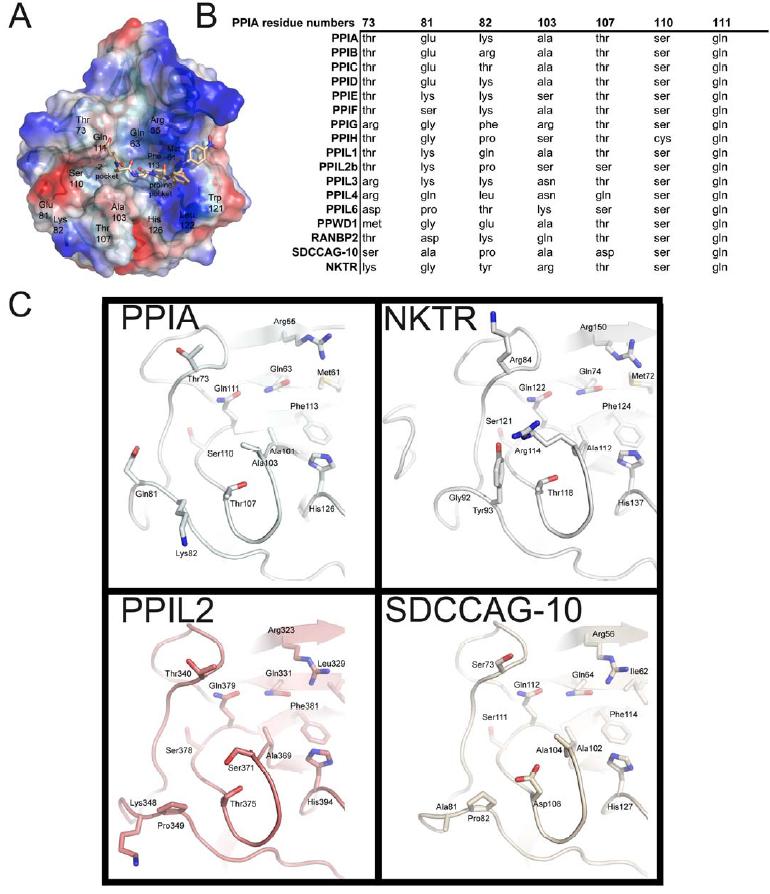
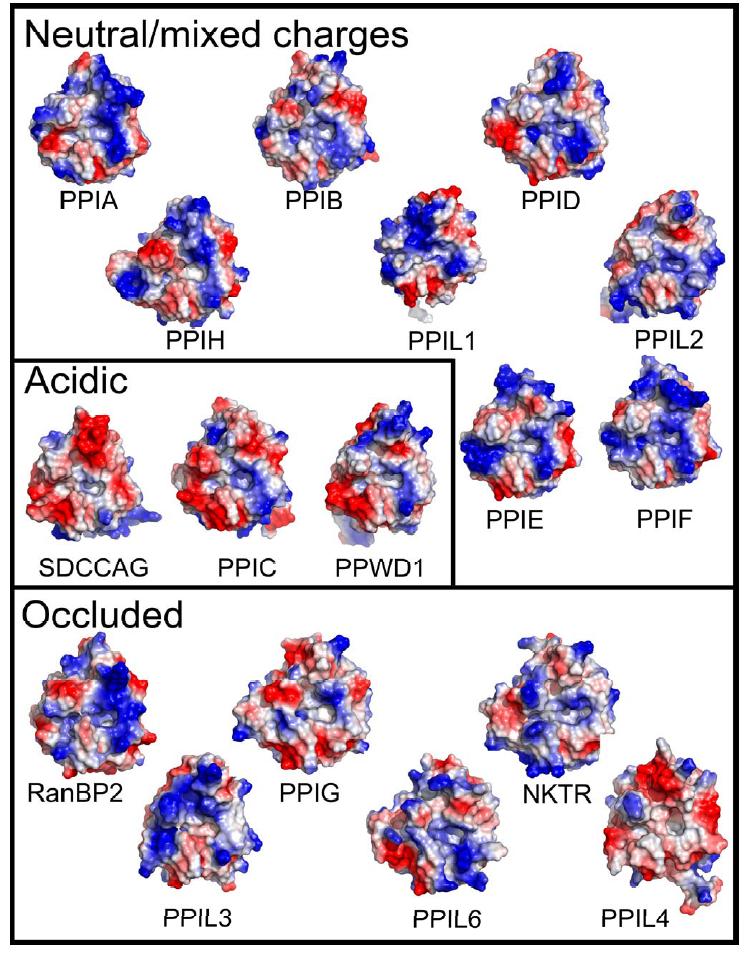
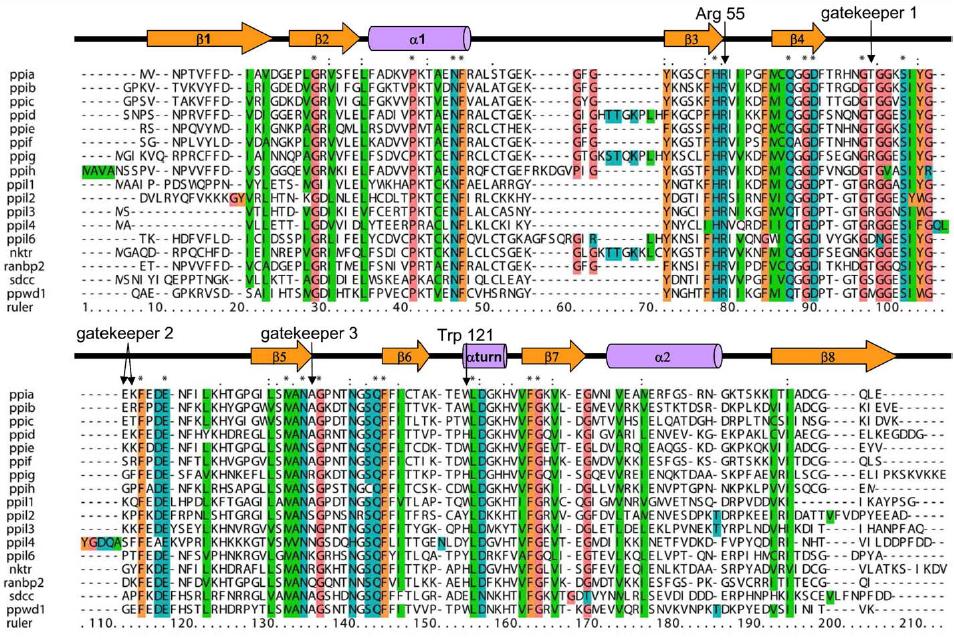
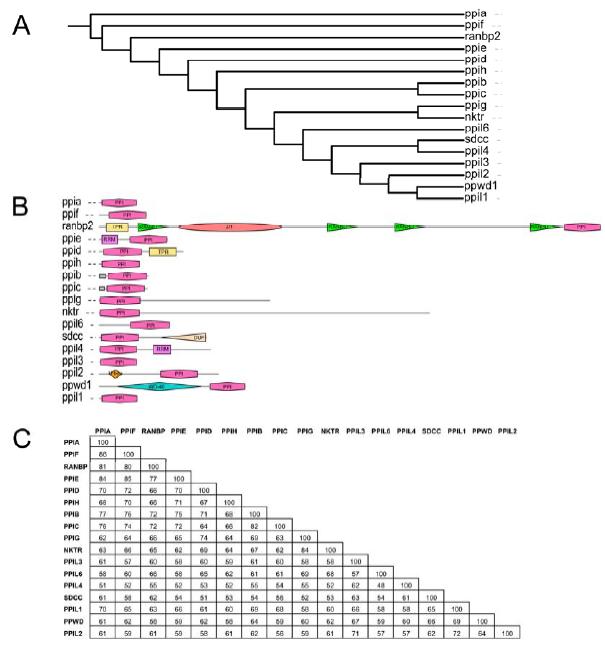
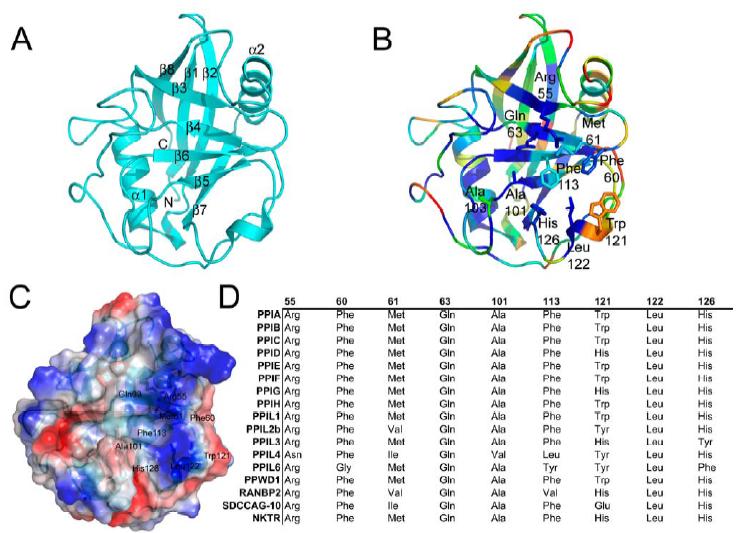
Figure 1. Structural elements of the cyclophilin fold and the definition of the active surface of PPIA.   (A) Secondary structural elements of PPIA in ribbon representation, with key structural elements labeled.  All structural outputs were generated using PyMol unless otherwise noted. (B) Consurf representation of sequence conservation within the human cyclophilin family; residues that comprise the active surface of the cyclophilin family are labeled [73].  (C) The molecular surface of the PPIA structure. The view is oriented roughly as in (A) and (B).  (D) Comparison of the sequences that define the active surface of the PPI domain. Residue numbering corresponds to PPIA.

Download Standalone iSee datapack: You can download and view all the Information of a datapack offline including information not available in the web version (where applicable). You will also need to download and install the ICM-Browser to view the standalone datapacks.

download datapack  download browser
Datapack created using Molsoft ICM and Molsoft Browser technologies. (Patent Pending)

Figure 2. The structural consequences of substitutions in the cyclophilin active site. The residues described in Figure 1 are shown in stick representation for the divergent family members PPIA, NKTR, PPIL2, and SDCCAG-10.  Note the orientation of the divergent residues Tyr389 in PPIL2 and Glu122 in SDCCAG-10 relative to Trp121 in PPIA or His132 in NKTR.

Figure 3.  Structural coverage of the human cyclophilin family.   Cartoon representation of the experimental and modeled structures of human cyclophilins.  Only the isomerase domain is shown.  Structures solved previously are shown in shades of grey, while the novel structures associated with this manuscript are colored.  The structures of RanBP2, PPIL6, and PPIL4 are marked with an asterisk, as they are derived from homology modeling using the Phyre server [42] and do not represent experimentally derived data.  The structures are arranged roughly according to their similarity to PPIA by sequence alignment (See Figure S3).

Figure 4. The  -2 “gatekeeper” region of the human cyclophilins.   (A) The definition of the proline pocket and -2 pocket is shown by depiction of a complex between PPIA and the tetrapeptide suc-AGPF-pNA (PDB 1ZKF).  (B) Comparison of the sequences that define the -2 pocket of the PPI domain.  Residue numbering corresponds to PPIA. (C) Sequence diversity of the gatekeeper residues in four PPI domain structures. As shown in Figure 5, these substitutions lead to diverse size and charge properties in this region of the cyclophilin active surface.

Figure 5. The diverse surfaces of the human cyclophilins.   Surfaces of the human cyclophilins are shown colored by qualitative electrostatic potential. The scales of the potentials are all roughly the same (averagepotential: -/+65 kBT/e) and range from -/+ 56 kBT/e for PPIGto -/+ 81kBT/e for PPIL4; all surfaces were calculated using the protein contact potential function in PyMol.  As discussed in the text, the surfaces have been generally divided into those with neutral or mixed charge character surrounding the -2 pocket; those with largely acidic character around the -2 pocket; and those whose gatekeeper residue identities lead to occlusion of the -2 pocket.

Figure 6. Peptide:protein simulations for five members of the cyclophilin family.   (A) Detailed results for PPIA.  Simulations were set up with the structure of PPIA as represented in PDB 1AK4 and with 400 peptides corresponding to the sequences X-Z-G-P, where X and Z are each of the possible combinations of thenaturally occurring 20 amino acids. Flexible residues in the protein correspond to the “gatekeepers” and are shown.  Below, two graphical representations showing the results of the simulation for PPIA. On the left, a scatter plot with the energy metric on the Y axis and the distance metric on the X axis.  The lower left quadrant is where the highest scoring peptide combinations are plotted (greatest negative energy and closest interaction with the -2 pocket). The color of each spot in the plot corresponds to the hydrogen bonding potential between that particular peptide and PPIA, with red indicating greater values and purple indicating lesser values. On the right, the identity of the residue at position -3 is plotted along the X axis, and the identity of the residue at the -2 position is plotted along the Y axis.  The general chemical classification for each residue is indicated. At the intersection of each X, Y point is a square representing the binding energy and distance metrics.  Red indicates greater binding energy for that X, Y pair; purple indicates lesser energy.  Larger squares fill the -2 pocket to a greater extent.  (B) X, Y arrays for four other cyclophilin simulations. Coloring and axes are as in (A).

Supplemental Figure S1.   Characterization of isomerases using an NMR-based tetrapeptide activity assay.    Amide-beta correlations of the Ala within the suc-AGPF-pNA peptide are shown from the 1H-1H TOCSY experimental results. Resonances in black are from peptide in the absence of protein; resonances in red are observed upon addition of the isomerase noted above each panel.  If there is acceleration of cis–trans isomerization that occurs on the fast NMR timescale - i.e. faster than the chemical shift differences between cis and trans resonances - then the individual resonances coalesce into a single set of resonances.  Notice in the cases of PPIL2 and especially SDCCAG-10 that although the resonances do not coalesce - and therefore there is no significant enhancement of isomerization - the peak centers do shift, indicating that the chemical environment of the peptide is changing upon addition of enzyme. We interpret this as binding, but not significant catalysis, for this protein:substrate pair.

Supplemental Figure S2. Sequence alignment of the human cyclophilin isomerase domains.   Key structural and catalytic residues discussed in the text are labeled.  Alignment was generated using CLUSTALX [74,75].

Supplemental Figure S3. Sequence-based data for the human cyclophilin isomerase domains. (A) Phylogenetic tree with domain organization for the seventeen annotated members of the cyclophilin family of isomerases.  (B) A graphical representation of the motifs found in multi domain cyclophilins.  Both figures were generated using the Interactive Tree of Life server [76].  (C) Diagonal table showing the percent sequence similarity between the isomerase domains.

Supplemental Figure S4.   The modeled effects of the residue identity at position 121 in relation to cyclosporin A binding.   In (A), the experimental structure of a complex between PPIA and cyclosporin A (PDB 2RMA) is shown.  The distance between the carbonyl moiety of methylleucine 9 and the indole nitrogen of Trp121 is shown.  In (B), Trp121 is shown mutated to histidine. The sidechain is oriented with a preferred rotamer conformation and corresponds to the experimentally observed rotamer found in NKTR, which has a naturally occurring histidine at this position.  In (C), Trp121 is shown mutated to a tyrosine.  The sidechain is oriented with a preferred rotamer position; the steric clashes with Phe60 and methylleucine 9 are severe and shown with the distances labeled.  In PPIL2, which encodes a tyrosine at this position, the rotamer position found is oriented in a way such that it avoid sthese potential steric clashes (see Figure 2).

Supplemental Figure S5.   Regions of structural diversity in the human cyclophilins.   The structures of the β1-β2, a 1-β3,and a 2-β8loops are shown for each class of structure as outlined in the text. 

Supplemental Figure S6 Additional results from simulations.   Scatterplots corresponding to the dynamic simulations on NKTR, PPIC, PPIL2, and PPWD1 are shown.  Axes and coloring are as inFigure 6.