Biovitrum's cheminformatics client application
BeeHive: User’s Guide
or How to BeeHive correctly
Biovitrum's cheminformatics client applicationBeeHive: User’s Guideor How to BeeHive correctly |
Version 1.18
John Marelius,
2002-02-19
Go to BeeHive
documentation index
Co to Compound
Ordering & Logistics (COOL) user guide
Browsing data from a database table
Operations with the result window
BeeHive is Biovitrum's new informatics tool for searching and managing data related to chemical compounds. This data ranges from physio-chemical information (e.g. the molecular structure or the measured solubility) to their biological effects on target bio-molecules (e.g. binding constants). The compound collection database is at the heart of BeeHive; all the chemical and biological data relating to in-house compounds is linked to it. Another core element of BeeHive, to which other data can be attached, is the target database. It contains information on the biomolecules that are targets, candidate targets or otherwise involved in the drug discovery projects. Most chemical and biological data is associated with a project, so the database of projects is also an important "linking point". Thus, the compound, target and project identifiers will probably be the search terms most often used to retrieve data from BeeHive. However, there is also room for other data, that is not linked to any particular drug discovery project or chemical compound. Bioinformatics data falls into this category. In the future, commercial chemical databases will be accessible through the BeeHive interface.
BeeHive is for everyone. One of its main purposes is to improve sharing of data within the company. Making all data available via a common interface means that while project rise and fall, project teams form and re-organise, BeeHive will look and behave the same. It also makes it easy for anyone to browse through data generated in other, perhaps older and/or "parked" projects. In contrast to the ISIS-based project databases which BeeHive largely replaces, old data remains accessible. BeeHive can easily be adapted to the needs of particular users or groups by building and storing frequently used views of relevant data as pre-defined database queries. Indeed, the "entry point" for most users will probably be through such project-specific database queries, which can easily be opened and executed to retrieve data.
A note on your privacy: For a period after the initial launch of BeeHive, some of your actions within the program will be logged. This is to collect statistics on how BeeHive is being used. When a program or database error occurs, the details of the error may be logged. This is to make support and debugging easier.
To access BeeHive, you need a database user account on the BeeHive database server. To request an account, fill out the on-line form at http://www-i.biovitrum.com/beehive. Note that today BeeHive accounts are separate from ISIS and COOL user accounts, but one day the same user account will be used in all applications.
BeeHive is a very lean application, that is it is small in relation to its functionality and not very memory- or compute-intensive. If your computer is capable of running Microsoft Office (97 or later) then BeeHive will also perform OK.
The BeeHive application resides on a file server and each time you start it, the latest version will be loaded from the server, meaning you never need to worry about version upgrades. However, to access the BeeHive database, you must install Oracle database client software as described below. If you already have the Oracle client installed, because you use software such as ActivityBase, then contact BeeHive support (after reading the Frequently answered questions page).
More detailed information is given at the BeeHive software page. In summary, to install the Oracle client software and the shortcut to BeeHive, do the following:
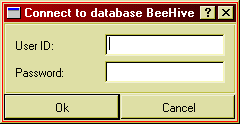
BeeHive will remember your user ID so you don't have to type it in the next time you log in at the same computer.
This section will present some concepts which are important to understand in order to use BeeHive.
When you have successfully logged in, you will see the main BeeHive window:
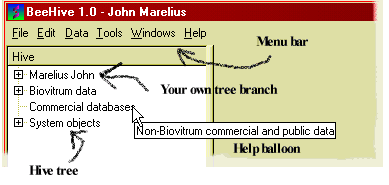
Figure 2: Components of the BeeHive main window.
Here, only the upper-left corner is included, but it shows the most important components:
The Hive tree is the leftmost component. You use it to navigate among all the data in BeeHive, like you navigate among files and directories on your computer with the Windows explorer. If you hold the mouse pointer still for a moment over a node (branch) of the tree, a little description will pop up, as shown above.
The branch of the tree that carries your name is like your home directory. Lists and queries that you create and save will appear under your own branch.
The menu bar has menus and menu items similar to those you find in most Windows programs. You use menu commands to start new tasks in BeeHive, such as opening a new window for building a query.
When you expand branches of the hive tree by clicking the little + icons, a hierarchy of objects is revealed. The tree nodes which cannot be expanded (with no + icon) represent individual columns of database tables:
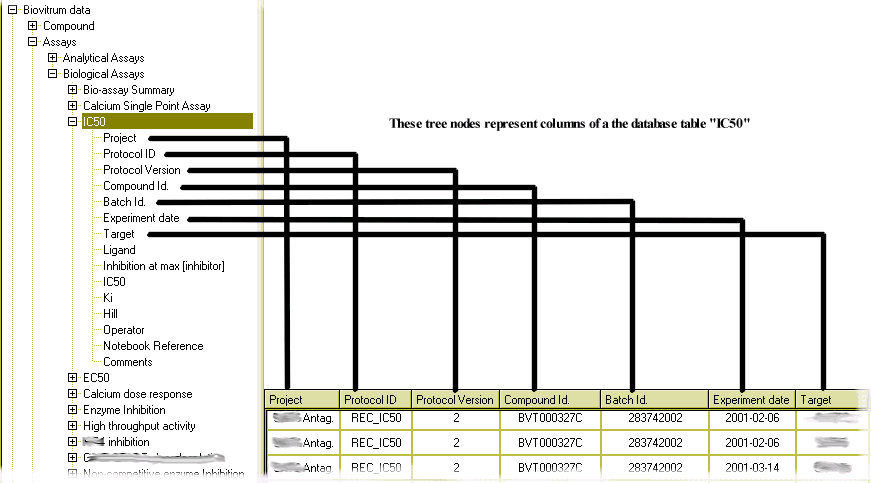
Figure 3: Tree nodes with no sub-nodes represent columns in database tables.
(All columns not shown.)
Some tree nodes represent other objects than columns of database tables, for example items under a project's "Lists" folder are lists which were constructed for that project. How to work with lists is covered below.
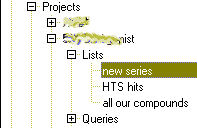
Figure 4: Tree nodes representing lists of e.g. compound IDs saved in a
project's list folder.
You retrieve the biological or chemical data you want from BeeHive by running a query. The query defines what kind of data you want to see (which columns from which database tables) as well as a filter, i.e. a set of conditions to restrict the amount of data retrieved. A query could be formulated like this: "Show me all compound IDs, structures and solubility values where the solubility is greater than 100 µM". Here, the first part "compound IDs, structures and solubility values" defines the kind of data you want to see. We call this the result part of the query. The latter part "where the solubility is greater than 100 µM" is the filter to restrict the query to only retrieve rows which match the conditions.
A query can also contain rules for processing the data, such as computing averages or re-formatting the data to show e.g. affinity for multiple targets as a selectivity table.
Queries can be seen as a set of instructions which are sent to the database server each time the query is run. As time passes and more data is added to the databases, the same query will return more data. It is important to understand that the query itself does not contain any data, it's just the instructions on how to get the data.
You can open and run pre-defined queries which someone else constructed, or you can build your own queries. Typically, there will be a number of pre-defined queries for each project stored in the project's query folder. See Opening a stored query and Building queries for details. When you save a query you have built, it appears in the "Queries" folder of your own Hive tree branch.
When you execute a query, a new window appears which shows the data returned by the query, in a tabular form. It is composed of the columns listed in the result part of the query, and all the rows of data which fulfilled the conditions of the filter. You can read the retrieved data on your screen, print it, export it to MS Excel, export chemical structures and make lists of the compound identifiers.
When you want to retrieve data about a given set of compounds (or batches of compounds, targets biomolecules, genes or whatever you can make a set of), you need to use a list. A list in BeeHive is simply a set of identifiers. It also has a type, such as "Compound IDs" or "batch numbers". Using the list editor, you can create a new list by typing in identifiers or pasting them from the clipboard. You can also save compound IDs or other identifiers from a column of a query result table as a list. When you save a list, it appears in the "Lists" folder of your Hive tree branch.
You use a list as a filter in a query, to restrict the data returned to data pertaining to the objects identified by the list elements. For example, if you use a list containing compound numbers 1,2 and 3 then your query result window would only contain data for compounds numbered 1, 2 or 3.
Pop-up menus are used in many places. A pop-up menu is shown when you click the right mouse button on an object and lets you choose commands relevant for that object. So, right-click your way around in BeeHive to see what you can do!
Help balloons also pop out from many tables, buttons and other objects when you hold the mouse pointer over them.
This section describes the basic operations in BeeHive, that every user needs to be familiar with. Once you manage these few and simple things, you will be able to use BeeHive in your daily work without being any kind of database wizard or computer scientist.
This is the simple procedure to open a pre-defined query, or a query which you saved earlier:
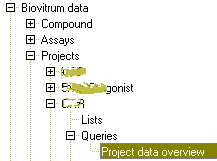
The section "Operations with the result window" describes what you can do with the query results.
In this section you will learn how to build the simplest form of query - the one which says "show me everything". Now, everything here means all the columns and all the rows of a single database table.
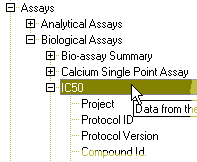
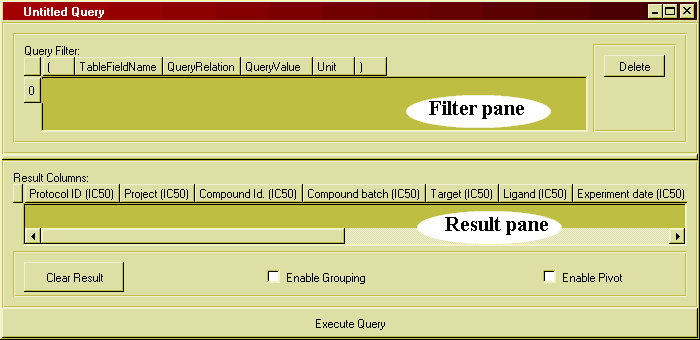

There are several things you can do with the result window:
If you want to further process the data returned by a query beyond what is possible within BeeHive, just one click is needed to continue working with the data in Microsoft Excel.

Figure 9: Right-click and select "Launch Excel..." to export data
to MS Excel.

Figure 10: The data from the BeeHive result window is now in Excel.
At present, chemical structures can not be exported in this way. Instead, use the function "Export SD file".
There are two ways to see chemical structures in BeeHive
To add structures as a results column in a query, drop the node
"Structure" from the "Compound" branch of the Hive tree onto
the result pane of the query builder window. When you execute the query, the
structures will be retrieved and shown as a column.
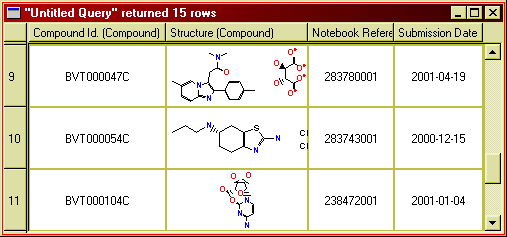
Figure 11: Chemical structures in the query result window. (The structures
shown are not from the Biovitrum compound collection.)
You may adjust the size of the structures by dragging the column or row heading. To permanently set the default size of structures, go to "Options" in the "Tools" menu.
A list in BeeHive is a collection of identifiers of a particular kind, for example compound IDs.
To create a new list, follow these steps:
Type in a list element in a cell in the column 'Element' of the table.
After each keystroke, BeeHive will test if what you types matches an identifier of the selected type (e.g. a compound ID) in the database. If it does, 'yes' will be shown in the column 'Valid'.
For list
elements associated with structures (e.g. compound IDs, batch numbers), the
structure will immediately show up in the preview pane.
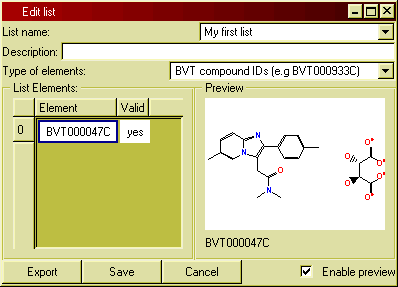
Figure 12: The list editor.
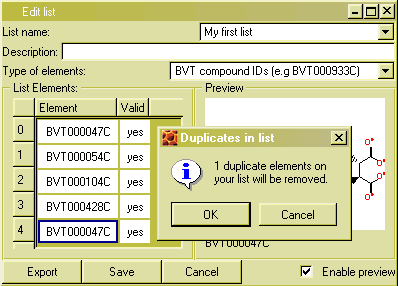
To open a saved list for editing, double-click its name in the list folder in the hive tree.
The point of a list is to use it as a filter, to retrieve only data related to the elements of the list. You would use a list of compound IDs to restrict the rows returned from a query to rows containing a compound ID from your list.
To use a list in a query, drag the list from the Hive tree (either from your own "Lists" folder) or from a project's list folder to the filter pane of the query builder window.

Figure 14: Using a list in the filter pane of the query builder.
With a large number of data tables and other objects in the Hive tree, it may take some time to navigate to a particular item. It is very easy to search the tree if you have a keyword which describes what you are looking for.
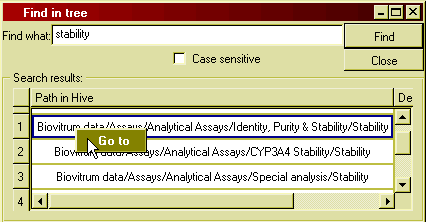
To change your password, select "Change password" from the "Tools" menu.
Select "Options" from the "Tools" menu to show the following dialog:
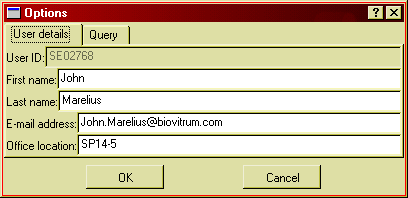
Figure 16: The options dialog window.
Use it if you need to change any of your contact details. The e-mail address is required to be able to use the support centre. You can also set various options concerning the query result window.
[To be added]
When you create or modify queries and lists, they are always saved in your own query or list folder. This is true even if you open an object in a project's list or query folder.
It is easy to copy objects from your own folders to a project's folder, provided you have the permission to do that. To request such permission, write a message in the support centre. You can always copy a query or a list from a project folder or from another user's folder to your own folder. Please note that you are really making a copy of the object, not just a shortcut to it, so if someone else changes the original object, your copy will be updated.
To copy an query, drag it from its original location in the tree and drop in onto the target folder in tree. You can only drop it on a query folder, not on an query inside the folder or on any other type of folder.
Consider the case when your query returns multiple rows for a single compound or other entity. This would be the case if you are looking at binding data and multiple experiments have been done with the same compound:
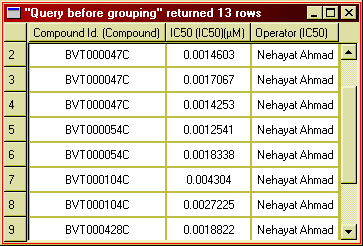
Figure 17: IC50 has been determined multiple times for each compound.
In order to present this data as an overview, you probably want to reduce it to one row per compound, and show the mean IC50 value. Its is easy to do this, and more, in BeeHive. Here is the same example after summarising the data:
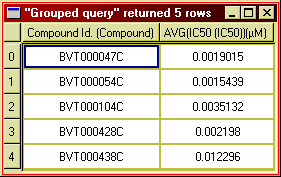
Figure 18: Computing average IC50 values.
Notice how the first table has been "collapsed" to show only a single row per compound, and the individual IC50 values replaced by the mean values (per compound). The column "Operator" was removed, because it is not meaningful to calculate the mean operator name.
This operation is knows as grouping. In the example we group by compound ID, meaning that the rows for each compound ID (in the first table) constitute a group. The mean IC50 value is then calculated for each group (here compound).
The mean value is only one of the so called aggregation functions - which collapse many values into one - that you can apply. You can use any combination of the following:
The three first functions can be applied to any type of data (numeric, text or date), but the mean and standard deviation only have a meaning for numeric columns.
To build a query with grouping, follow this procedure:
This is the result pane of the grouping example query:
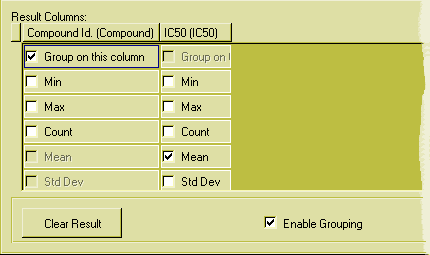
Figure 19: The result pane with grouping enabled.
If you don't group by or select any aggregate function for a column, data from that column will not appear in the result window. You cannot both collapse the rows into groups and show individual values!
The grouped query will be even more informative if you select not only the mean values but also the standard deviation and the number of values (count), by ticking also those boxes in the result pane.
As you see, you can easily do rather complex transformations of your data in this way, so complex that it is easy to lose the grip of what is actually happening. Do experiment with grouping, but be very careful about what conclusions you draw from the results until you are completely clear about exactly what you are doing with the data! It is always wise to build and run the query without grouping as a starting point. Do include the comments column, if available, at this stage to discover special details concerning individual data points. Then set up grouping and remove columns that cannot be aggregated.
Pivoting is a way of transforming query result data by stacking related rows
side by side, making more columns and less rows. As an example, let us look at
inhibition data for a few compounds against the family of SCRT (secretase)
isoenzymes SCRT-a, SRCT-b and SCRT-c.
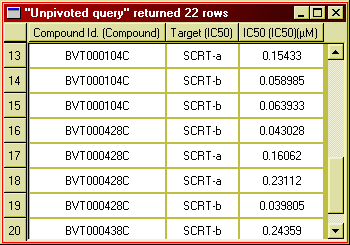
Figure 20: Inhibition data for different target on separate rows.
If we wanted to compare the IC50 values for the different targets, it would
be much easier to make a separate column for each target - a so called
selectivity table, like this:
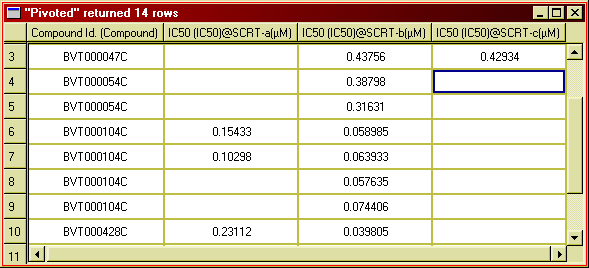
Figure 21: Inhibitor data organised into a separate columns for each target.
This transformation, combining several rows into one row with more columns is called pivoting. To build a query with pivoting, follow this procedure:
This is the result pane for the pivoting example query:

Figure 22: The result pane with pivoting enabled.
Once you master grouping and pivoting individually, you may combine the two features and build very advanced queries. When doing such complicated transformations, it is very important that you are absolutely clear about the grouping and pivoting concepts, and also that you are thoroughly familiar with the data you are processing.
If you have dropped a structure column in the result pane of your query, so that your result window includes a column with structures, then you can export the retrieved structures as an SD file.
At present, only the structures and compound IDs are written to the SD file, no other data from the result window is included.
You can make a list from a column of identifiers (compound IDs in any form, batch numbers etc) in your result window. Such a list can be useful if you want to make further queries to retrieve data for the same set of compounds (or other entities).

Figure 23: Use the pop-up menu on table column headers to create a list from
that column.
[To be added.]
[To be added.]
Help for BeeHive users is available in several ways:
The support centre window is shown when you select "Support centre" from the "Help" menu. Note that to be able to use it, you must have an e-mail address. Your address will nomally be registered when your account is created. If not, select "Options" from the "Tools" menu and fill it in.
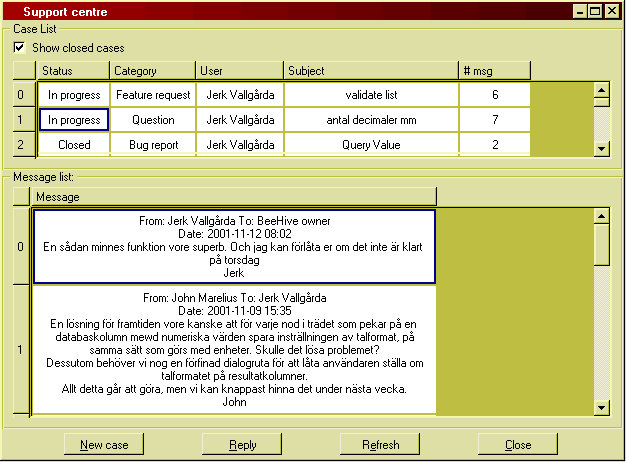
Figure 29: The BeeHive Support centre.
It has three main components:
Use the check box "Show closed cases" to toggle whether all your cases or only the ones that are in progress or new are listed.
To compose a new message, either to initiate a new case or to reply in a case in progress, you use the message composer window which comes up when you press the respective buttons:
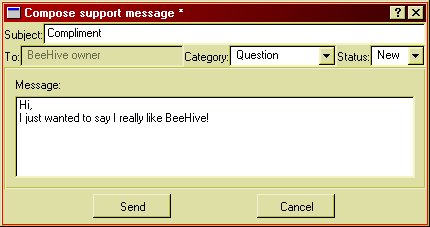
Figure 30: The support message composer.
Follow these simple steps to compose a message:
If you are composing a reply, you can't change the category. You may set the status to "Closed" if you are satisfied with the help you got and there be no further replies from either part. Note that you cannot reply to a closed case.
When someone in the support team replies to your case, you receive a notification by e-mail. You can the see the reply in the support centre.
term meaning query A view of data from one or more database tables. A query consists of a 'filter' part used to extract only data rows which meet specific criteria. The result part defines which columns from which tables should be retrieved. In database terminology, these are known as the "where" and "select" clauses, respectively. Additionally, processing of the data such as grouping or pivoting can also be defined in the query.
row A row, or a record, is a set of one value for each column in a table. Both database tables and the query result tables generated when a query is run are composed of rows. column A column, or a field, is a named location for a value of a particular kind. Many database tables of assay data have column named "project" and "experiment date". Many nodes in the hive tree represent columns from database tables. drag To press the left mouse button with the pointer on an object, move the mouse pointer "dragging" the object along. drop To release the left mouse button after a drag operation, "dropping" the dragged object in a new location. In BeeHive, dragging and dropping always makes copies of objects so the initial object will still be there.