Protein Structure Analysis |
 Click to enlarge image.
ICM-Pro provides a direct dynamic link to the Protein Data Bank (PDB). Once you have downloaded a structure you can analyse the structure - flagging problem regions, superimpose multiple structures, analyse distances and electrostatic properties. See below for a list of key protein structure analysis features. Return to Main ICM-Pro Page
| Dynamic link to the Protein Data Bank |
| One click search and download PDB structures. |
| Search PDB by keyword. |
| Search PDB by author. |
| Search PDB by experiment type or resolution. |
| Search PDB by Uniprot code. |
| Search PDB by chemical smiles string. |
| Search PDB by sequence pattern. |
| Search PDB by sequence homology. |
| Tabulated PDB data for easy manipulation, sorting and searching. |
| Read and display all NMR models from a single PDB file in one click. |
| Automatically display structure occupancy. |
| One-click to extract PDB sequence. |
| Find related chains in the PDB. |
| PDB File Preparation |
| Automatic but controled detection and fix of PDB problems. |
| Identification of optimal positions of added polar hydrogens. |
| Assignment of the most isomeric form of histidine. |
| Identification of the correct side-chain groups of glutamine and asparagine. |
| Protein Superposition |
| Superimpose multiple structures and calculate RMSD. |
| On the fly graphical superposition. |
| Superimpose by specific interatomic pairs. |
| Superimpose by 3D strucure using visible atoms, C-Alpha, backbone or heavy atoms. |
| Sequence alignment superposition. |
| Superimpose multiple protein structures by alignment, residue number, exact match and by visible atoms, C-Alpha, backbone or heavy atoms. |
| Weighted iterative superposition or single global supeposition for multiple proteins. |
| Calculate Contact Area |
| Calculate protein-protein (inter/intra) contact area. |
| Calculate protein-ligand contact area |
| Display contact residues according to their contact area e.g. thick sticks for highest contact. |
| Contact areas are tabulated in a fully-interactive clickable table. |
| Calculate Surface Area |
| Calculate solvent accessible area of many different selection types. |
| Surface area is tabulated in a fully-interactive clickable table. |
| Measure and Display Distances and Angles. |
| Measure distances between atoms (all to all, intermolecular or intramolecular).. |
| Measure planar angles. |
| Measure dihedral angles. |
| Display and undisplay distances and angles in the graphical user interface. |
| Ramachandran Plots |
| Build fully interactive clickable Ramachandran plots. |
| Tablulate Phi, Psi, Omg angles. |
| Save Ramachandran plot as a publication-quality image. |
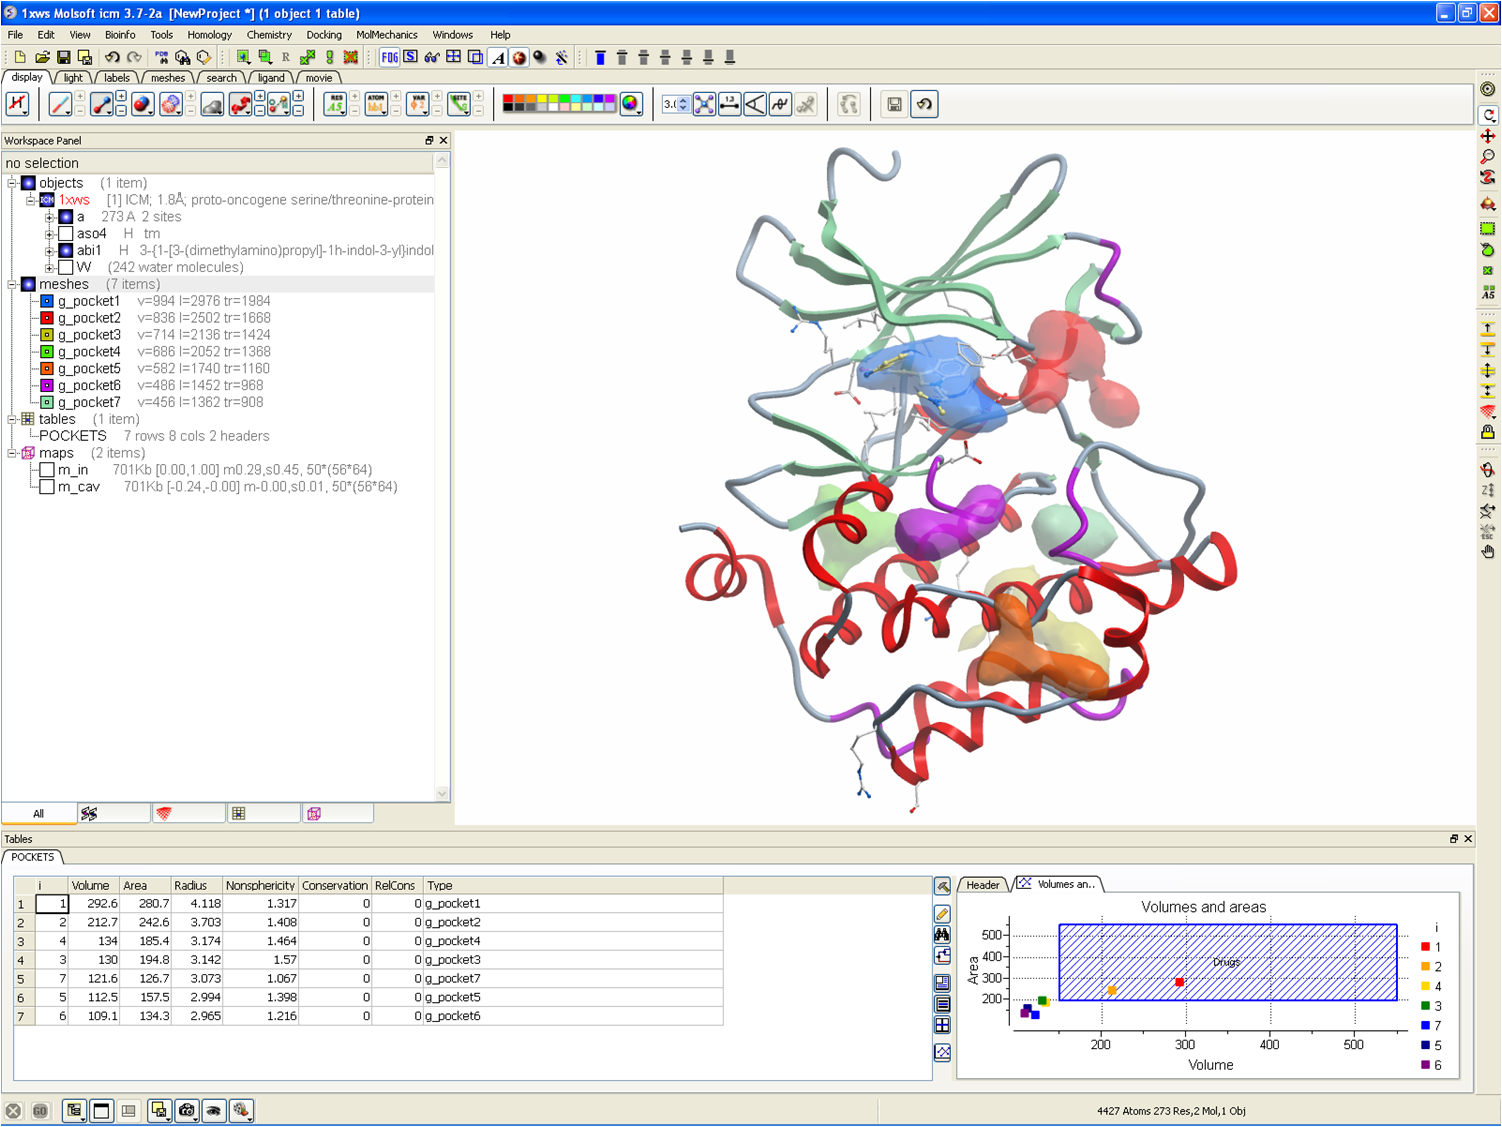
| Drug Binding Pocket and Cavity Identification |
| Calculate and display cavities and ligand pockets in a molecular structure |
| Calculate cavity volume, area and radius. |
| Display cavity and pocket neighboring atoms. |
| Volume and area of pockets displayed in fully interactive plot. |
| References: An et al 1995, Nicola et al 2008 |
| Protein-Protein Interaction Site Prediction |
| Protein-protein interaction site prediction using the ICM Optimal Docking Area (ODA) method. |
| Color the protein by protein-protein interaction hotspots. |
| Tabulate the ODA prediction for each residue in a fully-interactive table. |
| References: Fernandez-Recio et al 2005 |
| Protein Health |
| Calculate relative energy of each residue in a protein. |
| Color selected residues by strain. |
| Normalized Energy values for each residue are displayed in a fully interactive table. |
| Normalized Energy values for each residue are displayed in a fully interactive plot. |
| References: Maiorov and Abagyan 1998 |
| Predict Side Chain Flexibility |
| Systematically samples rotamers for each residue side-chain and uses the resulting ensemles to evaluate energy-weighted RMSD for every side-chain atom. |
| Color the structure by side-chain flexibility. |
| Conformational entropy for each residue side-chain is calculated and stored in a fully-interactive table. |
| Protein-Ligand Interactions |
| One click ligand pocket display. |
| Ligand pocket colored by binding properties. |
| Ligand surface colored by binding properties. |
| Color surface by proximity to Molecule. |
| Dynamic hydrogen bond display. |
| Display intermolecular hydrogen bonds. |
| Easy off and on display of hydrogen bonds. |
| Export hydrogen bond list to table. |
| Select hydrogen bond atom pairs. |
| Change the representation of hyrdrogen bonds (e.g. dotted line, spheres, solid line, telescopic, even). |
| Color hydrogen bond by energy (red strong-->blue weak) |
| Change the representation of hydrogen bond style based on energy or atom size} |
| Set the hydrogen bond minimum energy. |
© 2026 All Rights Reserved MolSoft LLC Terms of Use | Privacy Policy


