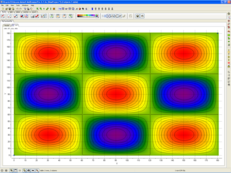
 Click to enlarge image.
- Make fully interactive colorful X-Y plots and histograms with up to 4 dimensions.
- Logarithmic scales.
- Change source and gradient of coloring.
- Least square fitting line
- Grid or plain background.
- Zoom translate and center.
- In built plot and 2D plot functions.
- Print and Save.
- Save as image.
- Inline table plots.
- Heatmaps.
- Plot annotation.
Return to ICM-Browser Main Page