| Available in the following product(s): ICM-VLS | |
Fragment screening docks a library of small chemical fragments into a receptor pocket. The results include fragment-specific statistical measures that complement the docking score. Selected fragments can provide starting points for growth or linking. This example screens fragments against the ATP-binding pocket of cAMP-dependent protein kinase.
 |
| Step 1 For this example we will use PDB file 1REK. It needs to be converted to an ICM Object and the waters and pentanal should be deleted. |
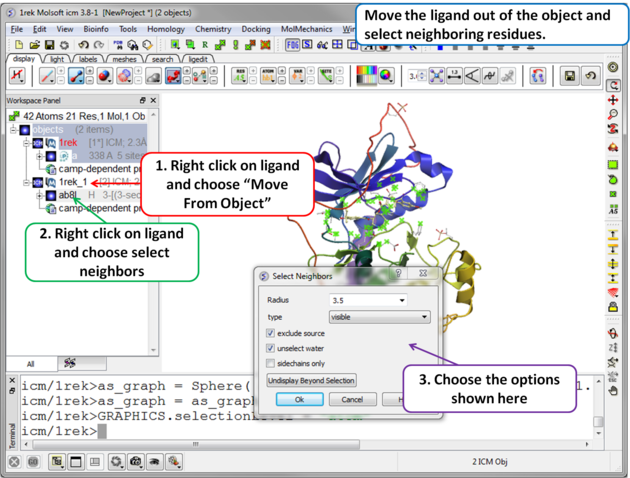 |
| Step 2 Move the ligand out of the object into a separate object so it is not included in the docking maps. Select the binding site by right clicking on the ligand and choose "Select Neighbors" in this example a radius of 3.5A is sufficient to select the pocket. Be careful not to select residues outside of the pocket because this could potentially include smaller cavities outside the pocket where fragments could bind. |
 |
| Step 3 Setup the docking project using the docking menu and the option "Setup Receptor". |
 |
| Step 4 The probe represents the docking starting position. Generally you can keep it in the default position. If you want to move it use the middle mouse button and hold the SHIFT button for global rotation. . |
 |
| Step 5 The purple box represents the region in which maps will be generated. To change the box size you can use the left mouse button with the cursor at any corner of the purple box to change it. It is important for fragment docking to minimize the number of cavities outside the pocket so to prevent fragments from docking outside of the pocket. Make sure the purple box is as close to the pocket as possible. . |
 |
| Step 6 To start the screening go to Docking/Scan Probes Fragments. A database of fragments is provided with the database distribution - the file is called fragments.icf. |
 |
| Step 7 The screen will take several minutes to run in the background. |
 |
Step 8 Once the screening has finished a table of the results will be displayed. The docked fragments can be viewed by toggling the view on and off using the buttons in the "L" column. Guide to the table columns:
|
 |
| Step 9 Sort the table by pvalue to rank the fragments. |
 |
| Step 10 To cluster the fragments by location in the pocket. Select the .Location. column and click on the cluster button. |
 |
| Step 11 Select representative centers from the cluster tree by lowest p-value. Selections will be highlighted in blue in the tree and the table. |
 |
| Step 12 Toggle through the selected fragments to choose lead candidates for linking using the Ligand Editor. |
Reload Fragment Screening Results To reload the fragment screening results:
- Docking/Open Project and locate the directory where your fragment screening results are located.
- Select Docking/Make Hitlist and browse for the Docking_Project_Name_Fragments.ob file which contains the results of the screen.
- A table as shown in Step 8 will be displayed.