| Prev | ICM User's Guide 13.1 Virtual Ligand Screening | Next |
[ VLS Intro | Start | Database Format | Preferences | Docking Project Table File | Run VLS in the Graphical User Interface | Parallelization | VLS Results | Post Screen Analysis | Visualization ]
| Available in the following product(s): ICM-VLS | |
| Additional Resources: Tutorial: Screen to Ricin Receptor | Tutorial: Screen to Cyclooxygenase | Tutorial: Screening a Markush Library | Command Line Docs | Video |
13.1.1 Virtual Ligand Screening |
Virtual Ligand Screening (VLS) in ICM is performed by docking a database of ligands to a receptor structure followed by an evaluation of the docked conformation with a binding-score function. Best-scoring ligands are then stored in the multiple icm-object file. The set-up of the VLS process is largely identical to the set-up for the small molecule docking simulation (see Small Molecule Docking section).
13.1.2 VLS Getting Started |
Follow the instructions in the small molecule docking section manual from docking project setup option to the calculate maps option. Use Docking/Setup Batch Ligand option to select the database you wish to dock.
13.1.3 Database File Format |
In most cases the ligand input file will be an SDF or MOL2 file. These files need to be indexed by ICM before they can be used in VLS runs. The index is used to allow fast access to an arbitrary molecular record in a large file such as an SDF file which in some cases contains over one million compounds.
To index an sdf file:
- Click on the menu Docking/Tools/Index Mol/Mol2 File/Database to generate the index. The following data entry box will be displayed.
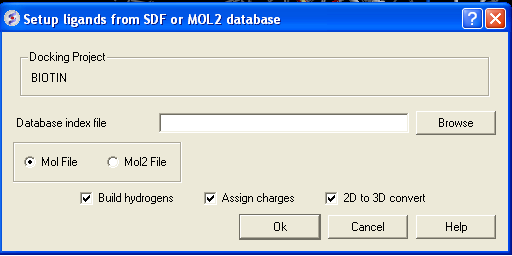
- Enter the name of your Mol/Mol2 file and enter the name you wish to call your index file.
- Select whether your file is in Mol or Mol2 format.
13.1.4 VLS Preferences |
| NOTE: It is important to setup the VLS preferences before undertaking VLS run. Additional preferences can be changed in the docking_project_name.dtb file. The fields in this file are described here: https://molsoft.com/addons/ftp/man/dockTable.pdf |
VLS preferences can be setup by:
- Selecting the menu Docking/Preferences/Database Scan
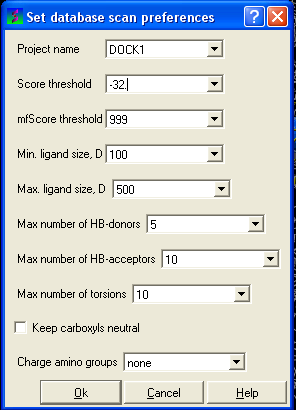
Different options are available to select by clicking the down arrow next to the data entry field. These options are described here:
Score Threshold:
An important parameter of the VLS run is the score threshold. Docked conformations for a particular ligand will only be stored by ICM VLS procedure if its binding-score is below the threshold. The choice of the threshold can be done in two ways: based on the scores calculated by docking known ligands. Generally, a value somewhat above typical score observed for known ligands is a good guess. If no ligands are known, a pre-simulation can be run using ~1000 compounds from the target database. Using the resulting statistics for the scores, the threshold should be set to retain ~1% of the ligands.
Potential of mean force score:
Potential of mean force calculation ( pmf ) provides an independent score of the strength of ligand-receptor interaction. The pmf-parameters are stored in the icm.pmf file.
Other selection criteria:
Other selection criteria which can be changed include
Minimum/Maximum Ligand Size you wish to be screened.
Maximum number of H-bond donors
Maximum number of H-bond acceptors
Maximum number of torsions
13.1.5 Docking Project Table File |
ICM VLS uses a number of criteria to pre-select compounds before docking. Edit the project .dtb file to change their defaults. A full description of each field in the .dtb file can be found here https://molsoft.com/addons/ftp/man/dockTable.pdf
#>i DOCK1.i_maxHdonors
5
#>i DOCK1.i_maxLigSize
500
#>i DOCK1.i_maxNO
10
#>i DOCK1.i_maxTorsion
10
#>i DOCK1.i_minLigSize
100
13.1.6 Run VLS in the Graphical User Interface |
First setup the docking project (From Set Project to Setup Batch Ligand)
To start the vls job:
- Docking/Run Docking Batch
13.1.7 VLS Job Parallelization on a Local Machine, Cluster or Cloud |
[ Gui Jobs | Vls command line ]
If the database size exceeds several thousand compounds, it is desirable to run a number of VLS jobs in parallel to speed up the calculations. You can do this in the GUI or on the command line on a cluster or cloud.
13.1.7.1 Sending Multiple Jobs in the GUI. |
In the GUI you can run the screening in parallel in the following ways.
- Setup the docking project.
- Check the docking preferences and the database scan preferences. If you are screening millions of chemicals it is usually a good idea to run a test screen of a smaller set so you can see the likely range of scores.
- Index the SDF file you wish to screen using Docking/Tools/Index Mol/Mol2 File/Database.
- Select the indexed database using Docking/Setup Batch Ligand/From Indexed Database.
- Docking/Run Docking VLS Batch and enter the number of CPU threads you wish to use on your local machine by entering the number in the Number of Parallel Jobs dialog window. For example if you have a 4 cpu machine with 2 threads each you could split your screening up into 8 parallel jobs.
- Then the docking will run. In your docking directory you will see multiple .ou file according to the number of parallel jobs you are runing.
Or there is a more interactive way as described below.
- Select Docking/Run Docking VLS Batch
- Select the Local VLS Batch option.
- Select the docking project name.
- Enter the compound number you would like to dock from e.g. 8001
- Enter the compound number you would like to dock to e.g. 10000
- License type: For nearly all licenses (e.g. standard ICM-VLS licenses) types you need to leave this entry blank. If you have a -vlscluster license or a molvls license (-vls) then select the option from the drop down list. Any questions first check your license.dat file or Email support@molsoft.com.
Or if you have a queuing system installed on the machine you are running the GUI you can use the tab VLS via Queueing System and this will split the jobs p via the number of jobs you specify and submit the jobs.
13.1.7.2 Sending jobs via the command line. |
To run vls on the command line on a server or cloud machine.
- Setup the docking project.
- Check the docking preferences and the database scan perferences. If you are screening millions of chemicals it is usually a good idea to run a test screen of a smaller set so you can see the likely range of scores.
- Index the SDF file you wish to screen using Docking/Tools/Index Mol/Mol2 File/Database.
- Select the indexed database using Docking/Setup Batch Ligand/From Indexed Database. Check that the path to the database is correct in the docking_project.dtb file - you might need to add the path in the fields shown below.
#>s dockCOX.s_dbFile
/home/molsoft/celebrex50.sdf
#>s dockCOX.s_dbIndex
/home/molsoft/celebrex50.inx
- Send the jobs using _dockScan.
13.1.8 VLS Results |
The easiest way to view the results of a VLS run is to make a hitlist. This was described earlier in the hitlist section of the small molecule docking chapter of the manual. Other ways of manipulating VLS data are described here:
13.1.9 Post Screen Analysis |
[ Sort Hitlist | Plot | Histogram | Scatterplot | Complex & H-bond Display | Calculate Properties | APF Cluster | Interaction Fingerprints ]
13.1.9.1 Sorting the compounds in your HITLIST |
Compounds can be sorted according to their SCORE and other properties in the hitlist. To sort the table single click on the column header - see the tables section of this manual for more information about manipulating tables.
13.1.9.2 How to Plot Histograms and Scatterplots of VLS Data |
The hitlist contains many columns with numerical data. ICM can build interactive plots with the table columns (See Tables section). However, there are some easy to use plotting options in the docking menu which is described here.
13.1.9.3 To construct a histogram of your VLS data |
- Select the menu Docking/Tools/Scan Results Histogram
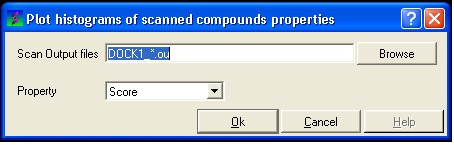
- Enter the name of the VLS output file (*.ou) you wish to construct a histogram for.
- Select which paramater you wish to plot against frequency (see below).
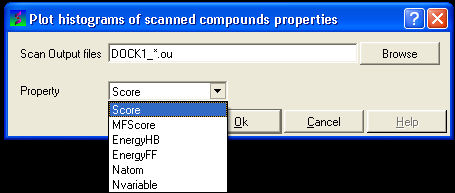
- Click OK and a def.eps file will be saved with a picture of your histogram.
13.1.9.4 To construct a scatterplot of your VLS data |
- Select the menu Docking/Tools/Scan Results Scatterplot
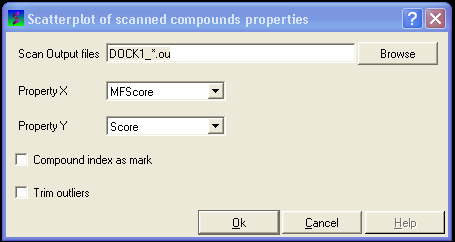
- Enter the name of the VLS output file (*.ou) you wish to construct a scatterplot for.
- Select which parameter you wish to on the X axis.
- Select which parameter you wish to on the Y axis.
- Click OK and a def.eps file will be saved with a picture of your scatterplot.
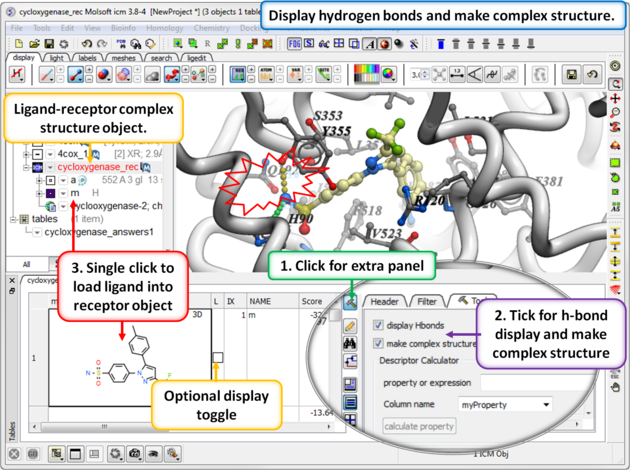
13.1.9.5 Hitlist - Make Complex and Display Hydrogen Bond |
When you make the hitlist you will see a panel next to the chemical table called Tools. The options here can be used to:
- Check the option display Hbonds if you would like to display hydrogen bonds when you browse the hitlist.
- Check the option make complex structure if you would like the ligand-receptor complex to be displayed when you browse the hitlist.
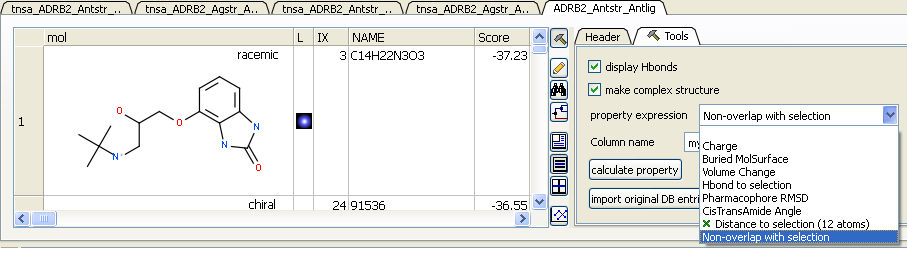
13.1.9.6 Post Screening Tools - Calculate Properties |
There are a selection of property expressions associated with the ligands in the hitlist that can be calculated. To use these press the 'hammer' button (top right of table) to open the Tools panel. Click on the drop down button next to the Property Expression button. The options include:
- Calculate charge of the ligands in the hitlist.
- Calculate buried surface of the ligands in the hitlist.
- Calculate volume change of the ligands in the hitlist.
- Calculate whether the ligand makes a hydrogen bond with a selection. Make a selection of the residue in the receptor first.
- Calculate pharmacophore RMSD. This property expression needs an object called 'pharma' loaded in the workspace, with the pharmacophore in it.
- Calculate cisTransAmide Angle of the ligands in the hitlist.
- Calculate distance to selection. Make a selection of the residue or atom in the receptor first.
- Calculate non-overlap with selection. Make a selection of the residue in the receptor first.
- APF pose similarity to a selected ligand. Make a selection of a ligand first.
- Calculate and cluster the interaction fingerprints.
Each of these properties will be placed in the hitlist table as a new column. You can choose a column name before calculating using the Column name dialog box. Click on the Calculate property button to run the calculation.
13.1.9.7 Cluster by APF Ligand Pose Similarity |
Screening results in the hitlist can also be clustered by 3D pharmacophore chemical pose simialarity using Atomic Property Fields. To do this:
- Make the hitlist (Docking/Make Hitlist)
- Press the Cluster by APF button on the Tools panel (right hand side of hitlist table).
- A tree will be displayed clustering the pose similarity of the compounds by APF fit.
- The distance matrix is added to the hitlist.
13.1.9.8 Interaction Fingerprints |
An interaction fingerprint can help choose docked ligands with common interactions or a diverse set of interactions.The fingerprint is a bit string representing a contact with each atom. For specificity there is a special subset of bit strings which represent hydrogen bonding. An alternative to interaction fingerprints is to cluster by 3D pharmacophoric similarity using APF.
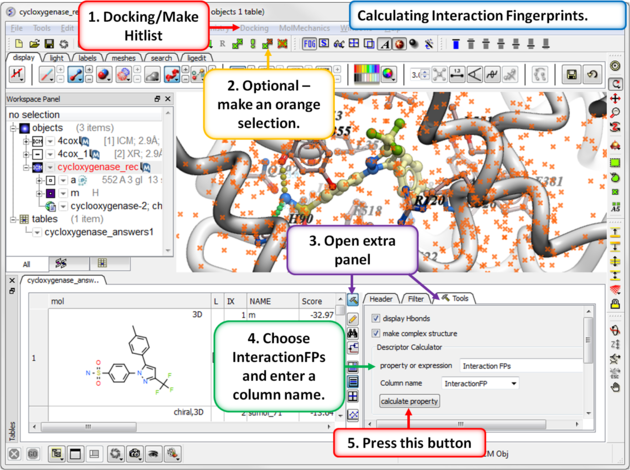 |
Step 1: Calculate Interaction Fingerprints
|
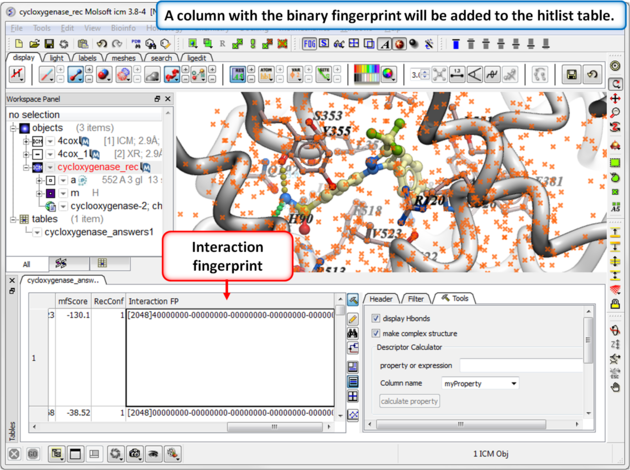 |
| Step 2: Once the calculation has finished a column will be added to the hitlist table. |
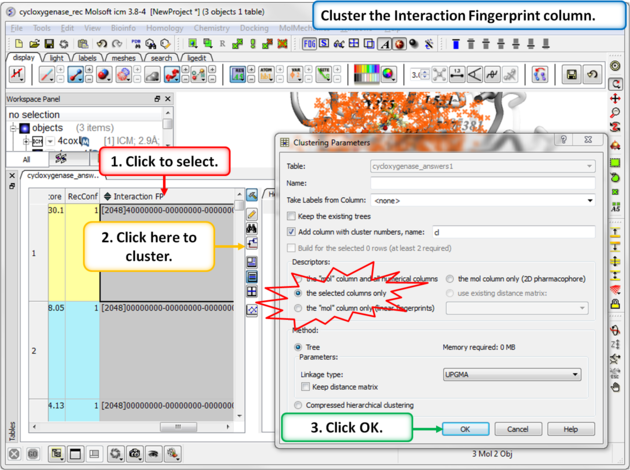 |
Step 3: Cluster the Fingerprints
|
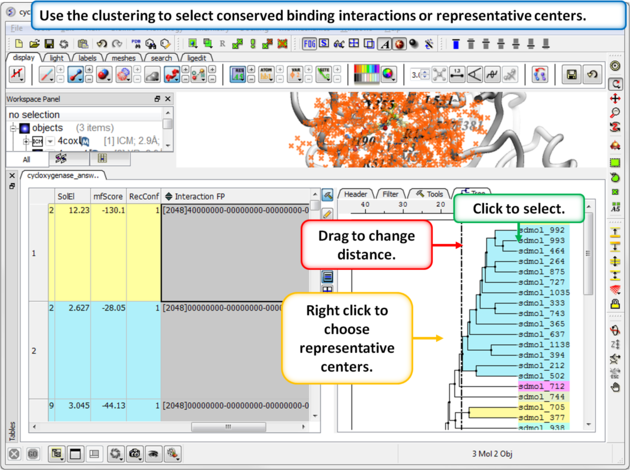 |
Step 4: Select representative centers or conserved binding interactions.
|
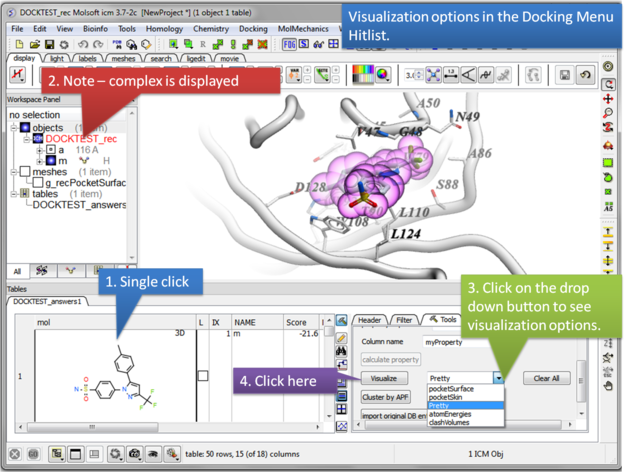
13.1.10 Post Screen Visualization |
Once you have made a hitlist of the screening results you can use the panel on the right hand side of the hitlist to change visualization options. The available options are:
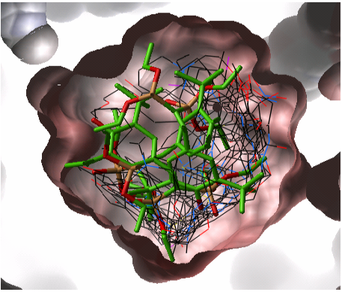
- pocketSurface = The surface of the ligand binding pocket. White=aromatic lipophilic, Green=non-aromatic other (mostly aliphatic) lipophilic surface, Red=hydrogen bonding acceptor potential, Blue=hydrogen bond donor potential
- pocketSkin = A skin representation of the neighboring residues.
- Pretty = A default representation for ligand and receptor (see image below).
- atomEnergies = An energy value for each atom in the ligand is displayed.Green and low numbers indicate a positive contribution to binding.
- clashVolumes = Highlights any clashes between ligand and receptor.
| Prev Virtual Screening | Home Up | Next Fragment Screening |