[ Hydrogen Bonds | PiPi ]
[ Edit Hydrogen Bond Label | Move Hydrogen Bond Label ]
| NOTE: The method by which hydrogen bonds are calculated is described here in the command line manual. |
- To display any energy-related interaction properties such as h-bonds, first convert the PDB structure into an ICM object. In this example we will Convert` 1STP into an ICM object.
- Right-click on the ligand 'abtn' in the ICM Workspace and select Neighbors**.
- Enter 3 angstroms for the distance and set Type = Visible**.
- Leave the ligand included in the selection by clearing the Exclude Source** checkbox.
- Open the Display** tab and click the Display H-Bond** button.
- You will then see the h-bonds displayed in the graphics window and the individual h-bondpairs in the 3D labels section of the ICM workspace.
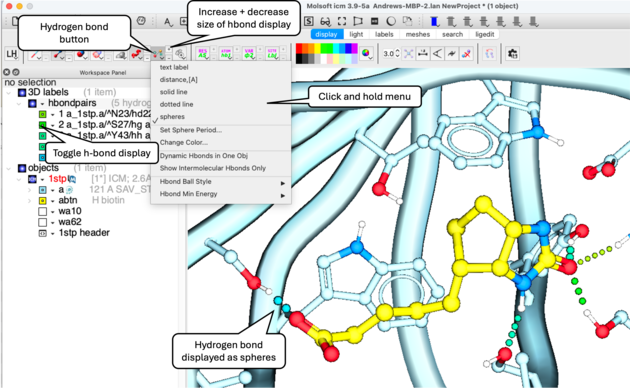
You can control different h-bonds options by clicking and holding on the h-bond button in the Display tab.
- Text label - Displays a text label identifying the atoms involved in each hydrogen bond.
- Distance [Å] - Displays the hydrogen bond distance, in Angstroms, as a label.
- Solid line - Displays hydrogen bonds as solid lines between the interacting atoms.
- Dotted line - Displays hydrogen bonds as dotted lines between the interacting atoms.
- Spheres - Displays hydrogen bonds as a series of spheres between the interacting atoms.
- Set Sphere Period... - Controls the spacing between the spheres used to represent hydrogen bonds.
- Change Color... - Changes the color used to display the hydrogen bonds.
- Dynamic Hbonds in One Obj - Dynamically updates hydrogen bonds within a single ICM object as the molecular geometry changes. Ideal for use with stacks.
- Show Intermolecular HBonds Only - Displays only hydrogen bonds formed between different molecules or molecular components and hides intramolecular hydrogen bonds.
- Hbond Ball Style - Controls the graphical style of the spheres used to display hydrogen bonds.
- Hbond Min Energy - Controls the threshold used to determine which hydrogen bonds are displayed. Adjusting this value can include or exclude weaker hydrogen bonds.
Right-click on the hbondpairs group in the ICM Workspace to access additional options for managing and analyzing the displayed hydrogen bonds.
- Select - Selects all hydrogen bonds contained in the hbondpairs group. This is useful for modifying, recoloring, exporting, or deleting the complete set of displayed hydrogen bonds.
- Protect - Protects the hbondpairs group from accidental modification or deletion.
- Change Color... - Changes the display color of all hydrogen bonds in the selected hbondpairs group.
- Export to Table - Exports information for the hydrogen bonds in the group to an ICM table for further inspection, sorting, or analysis. Includes distance and color used.
- Select atom pairs - Selects the atoms involved in the displayed hydrogen bonds. Both atoms participating in each hydrogen-bond interaction are included in the selection.
- Undisplay - Hides the hydrogen-bond graphics from the 3D display without deleting the hbondpairs group. The hydrogen bonds can be displayed again later from the ICM Workspace.
- Delete - Deletes the hbondpairs group and removes the corresponding hydrogen-bond display from the Workspace.
- Rename... - Renames the hbondpairs group. This is useful when several hydrogen-bond sets are displayed and clearer identification is required.
NOTE:
|
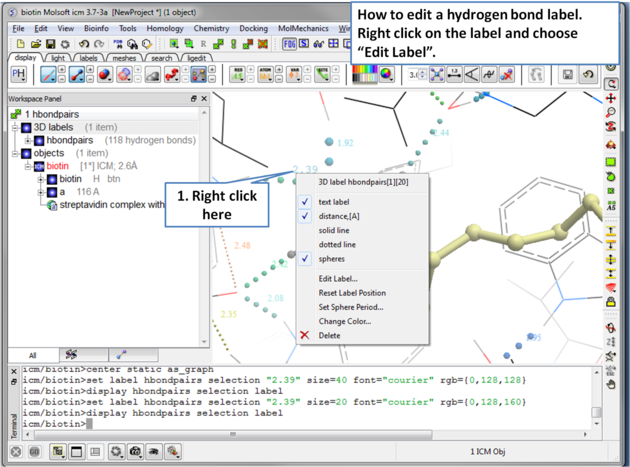
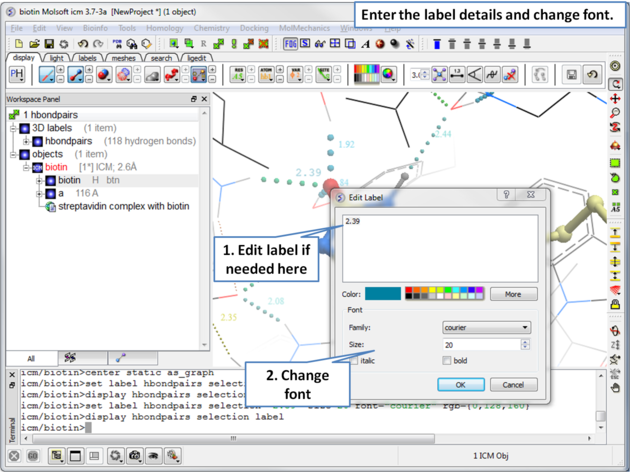
To edit a hydrogen bond label
- Right click on the label.
- Choose Edit Label.
- Make changes in the dialog box and press OK.
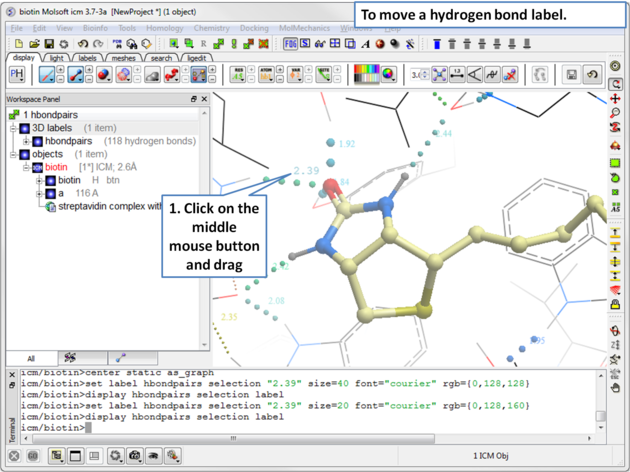
To move a hydrogen bond label
- Right click on the label.
- Click on the label using the middle mouse button.
- Hold the middle mouse button down and drag.
- Read in the molecule of interest.
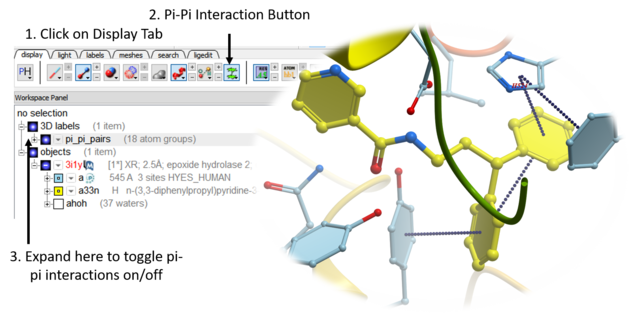
- Click on the Pi-Pi interactions button in the dispay tab. See image below.
- All pi-pi interactions will be shown in the display as dotted lines and listed in the ICM workspace.
- You can change the pi-pi maximum distance parameter by clicking and holding on the pi-pi interaction button.
- To display the distance of the pi-pi or pi-cation - open the 3D labels panel in the ICM workspace and locate the interaction. Right click on the blue box which controls the display and choose 'number'.