[ Customized Score | Binary Classification ]
Multi Parameter Optimzation (MPO) is a method that can be used to derive a score for the relative importance of a number of different chemical properties. You can create your own scores or use the ones built into ICM:
For example:
- Lipinski Rules (LopP, MW, Nof(HBD), Nof(HBA).
- CNS - Blood brain barrier permeation LogP, PSA, MW, pKa of most basic group, Nof(HBD). Model is based on Wager et al ACS Chem. Neurosci. 2016, 7, 6, 767-775.
- QED - Quantitative Estimate of DrugLikeness (see https://www.ncbi.nlm.nih.gov/pubmed/22270643)
About the MPO Method
- Multi Parameter Optimization (MPO) = set of properties + set of desirability functions
- The desirability function is an approach for combining multiple responses in a single optimization equation.
- A desirability function maps the value of a property onto a score in the range [0-1] that represents how desirable a compound with this property value would be.
- Total desirability (MPO score) index can be then calculated as an average.
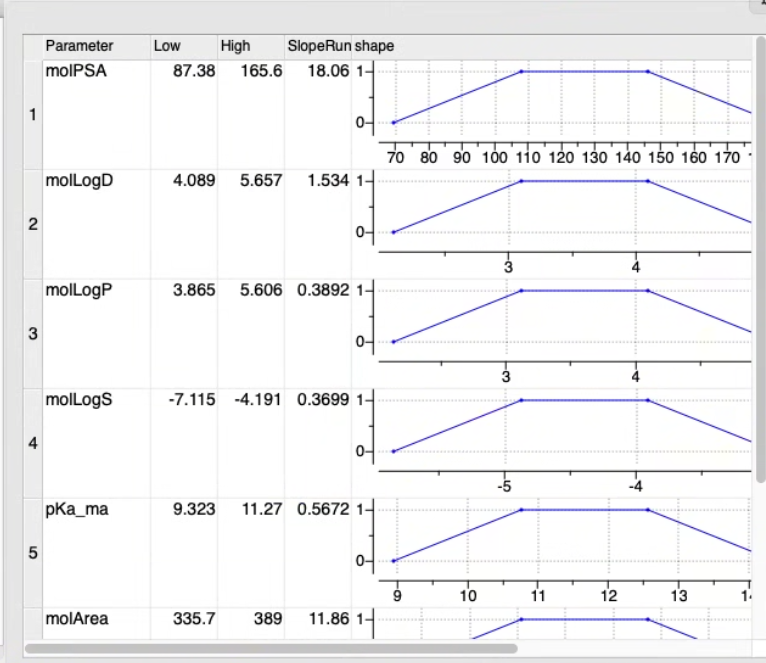
About the MPO desirability functions in the MPO table The MPO is grouped into a table where each row represents a single property:
- Low, High and SlopeRun: define shape of the desirability function
- Weight : importance
- Formula : expression for automatic calculation
- Value : for discrete columns (e.g. string arrays)
- Name, Color
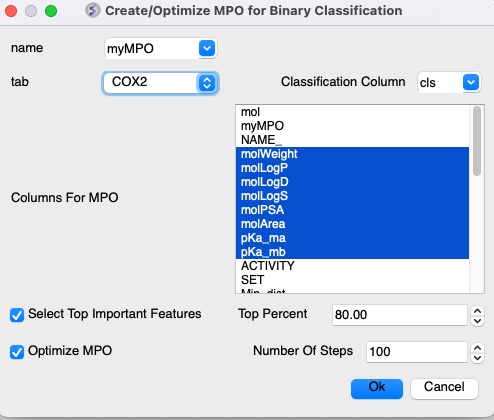
To run MPO:
- Read in a Chemical table. MPO can work with the 2D sketch in the 'mol' column or using a column containing SMILES.
- Chemistry/MPO/Create New MPO Score
- Select the built-in Lipinski, CNS, QED, parameters or make your own by choosing Empty.
- Choose whether you want to assign property colors and click OK.
- You will then see a panel on the right hand side of the spreadsheet under the table Tools tab.
- If you chose "Empty" you will need to add parameters either from MolSoft's inbuilt functions or from an existing column.
- If needed adjust the High, Low, SlopeRun, Value and Weight columns for each property parameter by clicking in the cell and editing. You will see the plot in the shape column adjust according to your input.

- Click on Calculate MPO Score and a results table will be displayed containing a Score and the parameter bars.
- Sort the Score column (myMPO).
[ Special Cases | Step Function | Save and Apply ]
MPO step function shape is define by 3 parameters: Low, High, SlopeRun (resize column to see the full name)
Below picture illustrates meaning of these parameters.

- SlopeRun = 0 defines vertical step

- Low = ND or High = ND defines "open interval" in one direction

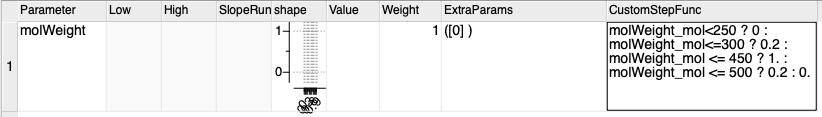
- Double-click the 'CustomStepFunc' cell in the desired row (property) to add a step function, then enter the expression (formula) that defines the step function (see below).
- Formula have 'x' as an input variable (values of column from 'Parameter' will be applied).
- Conditional expression can be define in form < cond > ? < value_if_true > : < value_if_false >.
- Conditional expression can be arbitrary nested.
- For example function below can be defined as: x<=25?2.2:x<=45?1.8:x<=65?1.4:1.2

Note that MPO expects each result from step function to be in range [0-1], so the expression should be normalized (e.g: as shown below)
(x<=25?2.2:x<=45?1.8:x<=65?1.4:1.2)/2.2

Another step function example molWeight_mol<250 ? 0 : molWeight_mol<=300 ? 0.2 : molWeight_mol <= 450 ? 1. : molWeight_mol <= 500 ? 0.2 : 0.
Saving and Applying the MPO Model
The MPO model can be saved in .tab or .icb format. To save the model, right-click on the myMPO table header tab and choose the appropriate option.
To reuse an MPO model:
- Open a new chemical table.
- Load the previously saved MPO model.
- Click on Calculate MPO Score button in Tools section of the MPO model table.
Important Considerations
- Required Columns: MPO may require specific columns to be calculated, created, or loaded before it can be applied.
- External Data: If you load external data containing numerical columns, those columns do not have formulas.
- Formula-Based Columns: On-the-fly calculations using formulas are only applicable for columns created within ICM, typically from Chemical Properties (e.g. MolWeight, MolLogD etc..) or other special cases.
- General User Data: Ensure that all necessary columns are present before applying the MPO model.