[ Interpreting PROTAC Conformers in ICM ]
 |
Targeted Protein Degradation (TPD) is an approach that is attracting substantial interest for modulating challenging drug
targets. A major class of TPDs are Proteolysis-Targeting Chimera protein degraders (PROTACs). PROTACs are heterobifunctional molecules in which two ligands are joined by a linker. One ligand recruits the target and the other recruits and binds an E3 ubiquitin ligase. Formation of a productive ternary complex can promote ubiquitylation of the target and degradation by the ubiquitin-proteasome system, the PROTAC is then recycled.
PROTAC Modeling Workflow
|
How to Run PROTAC Modeling - Example Bromodomain-Cereblon PROTAC: Setup
- Read into ICM the target PDB Bromodomain "3mxf" and Cereblon "4CI1".
- Delete molecules that are not needed - you should have just the ligand and receptor for both the target and cereblon. To delete hold "CTL" button and left click on the molecules you want to delete - then right click and choose delete.
- Convert both PDBs into an ICM object.
- Prepare the PROTAC molecule you want to dock - you can sketch it, read in a mol file or extract it from a PDB. In this example we extract the PROTAC in pdb "6bn7" which is the Bromodomain-Cereblon-PROTAC complex.
Run PROTAC Modeling
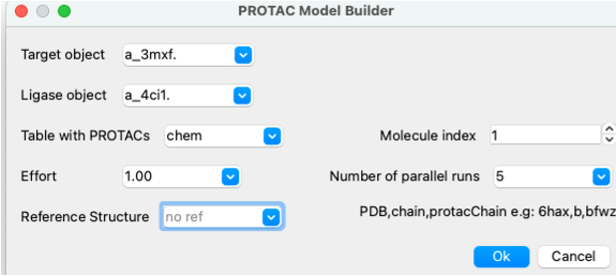
- Docking/Protein-Protein Docking/PROTAC Model Builder
- Select the target and Ligase object from the drop down button. In this example target=a_3mxf. ligase=a_4ci1.
- Enter the name of the table that contains your PROTAC. Molecule index= row number if you have multiple PROTACS in the table.
- Effort is the length of the simulation and changes Monte-Carlo simulation thoroughness (length of simulation) , e.g. effort=3. for more extensive sampling. If you are running five parallel runs then effort=1. is fine.
- Enter the number of parallel runs - we recommend 5 runs.
- Optional. For evaluation purposes: calculate PROTAC RMSD versus PDB structure, e.g., for this example we can compare with the Bromodomain-Cereblon-PROTAC complex pdb 6bn7 'b' chain and name of protac molecule 'brn3' so enter: 6bn7,b,brn3.
- Click OK to run the simulation - you will see a progress bar (bottom right) you can also monitor using Windows/Background jobs.
Results When the simulation has finished a dialog box will be displayed asking you to display the results. Click OK and a table of the results will be displayed. Single click on a row and the PROTAC complex will be displayed and loaded into the ICM Workspace (left hand side panel). The complexes are ranked by the energy column 'ener'.
- i = rank order
- ener = total energy this is the main score for ranking
- rmsd = RMSD to reference structure (if provided)
- comm = user defined comments as string
- ey = force-field energy
- sf = surface energy term.
- vw = nonbonded interatomic pairwise interactions van der Waals energy.
- el = Electrostatic energy
- deltaSurf = deltaSurf is the solvent-accessible surface area buried between the two proteins (the degrader small molecule is not included in this calculation)
- EnerSc = Energy of side chains
[ Rank modeled complexes using ener | Use clustering to identify families of similar low-energy conformers ]
The ener column is the total energy reported for each modeled complex and is the main ranking value in this workflow. Inspect the protein arrangement, linker geometry, and intermolecular contacts alongside this value. The lowest-energy model is not necessarily the biologically relevant complex.
Clustering groups similar modeled complexes and helps identify recurring arrangements across sampling runs. Inspect representative low-energy members from several clusters. Cluster size alone is not a thermodynamic population estimate, and an isolated low-energy model should be inspected rather than automatically discarded.