| Prev | ICM User's Guide 13.4 Protein-Protein Interface Prediction | Next |
The ICM Optimal Docking Area method is a useful way of prediciting likely protein-protein interaction interfaces. If you do not have mutational data or other experimental data which indicates the likely protein-protein docking site this method will be useful. This procedure can save you time during the docking procedure by focusing your docking only on areas on the receptor and ligand most likely to interact.
Theory
ODA (Optimal Docking Areas) is a new method to predict protein-protein interaction sites on protein surfaces. It identifies optimal surface patches with the lowest docking desolvation energy values as calculated by atomic solvation parameters (ASP) derived from octanol/water transfer experiments and adjusted for protein-protein docking. The predictor has been benchmarked on 66 non-homologous unbound structures, and the identified interactions points (top 10 ODA hot-spots) are correctly located in 70% of the cases (80% if we disregard NMR structures). For a description of the method see Fernandez-Recio et al Proteins (2005) 127: 9632.
To display the optimal docking area.
- Convert the PDB file to an ICM object.
- Tools/3D Predict/Protein Interface by ODA
- If you select the Residue Table option the average ODA score for each residue will be displayed in a table. The lower the number the higher the chance the residue will be involved in protein-protein interactions. Regions colored red represent low ODA score and blue represents a high score.
ODA Example with a subtilisin-chymotrypsin complex.
As an example we will determine whether the ICM-ODA method can accurately predict the binding surface of the complex between subtilisin and chymotrypsin. This example is used in the protein-protein docking tutorial below as well.
This complex has been solved experimentally and has PDB id 2sni.
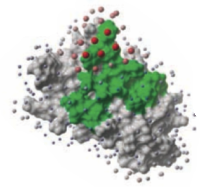
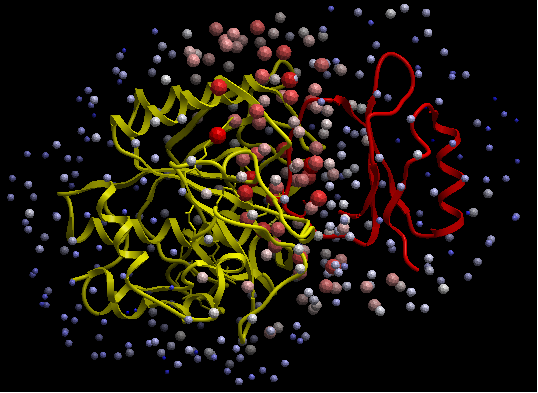
Calculate the ODA for each subunit (Tools/3D Predict / Protein Interface by ODA).
ODA for subtilisin and ODA for chymotrypsin - red colored spheres indicate a region highly likely to be involved in protein-protein interaction, blue coloring is unlikely to be involved in protein-protein interaction. A clickable table is also displayed with ODA values.
| Prev Local Flexibility | Home Up | Next Identify Ligand Pockets |