[ properties | Number of Atoms | Tox Score | Blood Brain Barrier Score | MolSynth Score | LogD | PSA ]
| Available in the following product(s): ICM-Chemist | ICM-Chemist-Pro | ICM-VLS |
| Video |
To calculate chemical properties for compounds within a chemical table:
- Read in the chemical table.
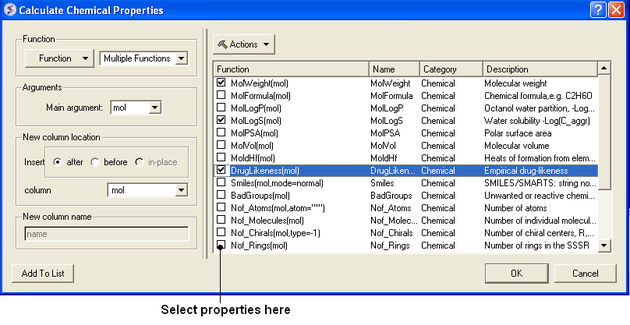
- Select Chemistry/Calculate Properties and a window as shown below will be displayed.
- Arguments - usually the column with the chemical structure is called mol. If this is not the case click on the drop down button and select the correct column.
- New column location - select where you would like to insert the new columns.
- New column name - This option is usually greyed out but the column name will be the same as the property name.
- Select the properties you wish to calculate using the 'tick' check boxes.
- Click OK and the properties will be added as new columns in the chemical table.
Actions Button Helps with Selections
If you click on the drop down button labeled Actions you will see 3 selection options:
- Select All properties.
- Uncheck selected options.
- Remove unchecked.
The table below summarizes the available properties in Chemistry/Calculate Properties.
Chemical Descriptor Data
| Name (MolWeight(type)...) | Name (molWeight) | Type (Chemical) | Description |
|---|---|---|---|
| MolWeight(type) | molWeight | Chemical | Monoisotopic molecular weight from .mol [Daltons] |
| MolAverage(type) | molAverage | Chemical | Average isotopic molecular weight from .mol [Daltons] |
| MolFormula | molFormula | Chemical | Chemical formula (e.g., C2H6O) from .mol |
| MolIUPAC | molIUPAC | Chemical | IUPAC name of compound from .mol |
| MolLogP(mol) | molLogP | Chemical | Octanol water partition, LogP(oct/w), of a chemical from .mol |
| MolLogD(mol) | molLogD | Chemical | LogD at a pH of 7.4 of partition of a chemical compound between the lipid and aqueous phases |
| MolLogS(mol) | molLogS | Chemical | Water solubility, LogS(mol): 10-based logarithm of the solubility in mol/L or M units predicted from .mol |
| MolRefractivity | molRefractivity | Chemical | Polarizability and electronic properties from .mol |
| MolSurfaceArea | molSurfaceArea | Chemical | Total surface area in square angstroms from .mol |
| MolVolume(mol) | molVolume | Chemical | Molecular volume in cubic angstroms from .mol |
| MolHl(mol) | molHl | Chemical | Heats of formation from elements in kJ/mol from .mol |
| pKa_acidic(mol) | pKa_acidic | Chemical | Calculate the basic pKa Acidic Group |
| pKa_basic(mol) | pKa_basic | Chemical | Calculate the acidic pKa Basic Group |
| MolSmiles(mol) | molSmiles | Chemical | Chemical SMARTS String Notation |
| Smiles(mol,order=unique) | smiles | Chemical | SMILES/SMARTS: String notation of chemical or chemical patterns derived from .mol |
| Atom Counts(mol,order=unique) | atom_Counts | Chemical | Atom counts |
| Bond Counts(mol) | bond_Counts | Chemical | Bond counts |
| TopologicalDescriptors(mol) | topological_Descriptors | Chemical | Molecular connectivity and shape indices |
| BadGroups(mol) | badGroups | Chemical | Unwanted or reactive chemical functionality from .mol |
| Not_Atoms(mol,atom=...) | Not_Atoms | Chemical | Number of atoms from .mol |
| Not_Atoms(mol,frag) | not_Molecules | Chemical | Number of molecular molecules in .mol drawings |
| Not_Fragmented(mol,frag=...) | not_Fragments | Chemical | Number of fragments |
| Not_Chiral(mol,type=...) | not_Chirals | Chemical | Number of chiral centers, R,S or (RS) from .mol |
| Not_Rings(mol,type=any) | Not_Rings | Chemical | Number of rings in SSSR |
| Not_Rings_size(mol,size=...) | not_Rings_Si... | Chemical | Number of given size rings in SSSR |
| Min_Rings_Size(mol) | min_Rings_Si... | Chemical | Largest independent ring size from .mol |
| Min_Rings_Size(mol) | min_Rings_Si... | Chemical | Smallest independent ring size from .mol |
| Max_Fused_Rings(mol,a...) | max_Fused_... | Chemical | Number of elementary rings in the largest fused ring from .mol |
| Not_RotB(mol) | not_RotB | Chemical | Number of freely rotatable bonds from .mol |
| Not_HBA(mol,electron_pa...) | not_HBA | Chemical | Number of hydrogen bond acceptors from .mol |
| Not_HBD(mol) | not_HBD | Chemical | Number of hydrogen bond donors from .mol |
| MolPSA3D(mol,3D_con...) | molPSA_3D | Chemical | Calculated polarisable Polar Surface Area from 3D structure |
| Fsp_3(mol) | fsp_3 | Chemical | Number of sp(3) hybridized extcarbon/totalcarbon count |
| MolCharge(mol,pH=7.4,o...) | molCharge_L... | Chemical | Calculate total formal charge at given pH |
| BBB_Prediction(Barrier=...) | bbbPred | Chemical | Calculate the Blood Brain Barrier (BBB) Score |
| CalculateHbond(mol) | hBon | Chemical | Calculate Hbond string |
| InChlKey(mol,options=) | InChlKey | Chemical | Calculate InChI key string |
| Struct2IUPAC(mol) | iupac | Chemical | Convert structure to IUPAC (online) |
| PubChem CD From Stru... | cid | Chemical | Retrieve PubChem CD by structure (FAST) |
| Name From PubChem(mol...) | mol_name | Chemical | Convert Structure to Name or PubChem CID using PubChem server (SLOW) |
| MolSMILES_to_db(mol,db) | molSMILES_to... | Chemical | Check SMILES identity from various |
| DrugBank ID(mol) | DrugBank_ID | DrugBank | |
| Structure to Name(name,l...) | name | Chemical | Translate chemical structure to Name,CAS,DrugBank extID,ChemBLID or other using MolSoft server |
| MolBBBscore(mol) | molBBBscore | MolScreen.T... | Predict BBB score. value >0.5 indicates high probability of getting through BBB. |
| MolCACO2(mol) | molCACO2 | MolScreen.T... | Predict Caco-2 permeability compound LogP value >0.5 indicates high permeability, <0.5 indicates low permeability |
| MolFAMILY(mol) | MolFAMILY | MolScreen.T... | Predict to which Protein Family the ligand binds |
| MolHERG | MolHERG | MolScreen.T... | Predict hERG inhibition. a value >0.5 indicates high probability of being a hERG inhibitor |
| MolHIA(mol) | MolHIA | MolScreen.T... | Predict Human Intestinal Absorption. a value >0.5 indicates high probability of being absorbed by human intestine |
| MolANTIINFLAMATION(mol) | MolANTIINFLAMATION | MolScreen.T... | Predict Anti-Inflammation activity. a value >0.5 indicates high probability of being Anti-Inflammatory |
| MolHALFLIFE(mol) | MolHALFLIFE | MolScreen.T... | Predict Half life in human plasma and Plasma in hour |
| MolLD50(mol) | MolLD50 | MolScreen.T... | Predict LD50 Dose in mg/kg. a value of 0 indicates 1mg/kg low toxicity, 2 indicates 100mg/kg low toxicity |
| MolLogPIRME(mol) | MolLogPIRME | MolScreen.T... | Predict Log Permeability of PAMP. CACO2 in cm/sec. a value >0.5 indicates high permeability, <0.5 indicates low permeability. Efflux ratio of CACO2 >2, indicates active efflux |
| MolPAINS | MolPAINS | MolScreen.T... | Predict Pan Assay Interference Compounds (PAINS). a value >0.5 indicates high probability of being a PAINS Compound |
| MolPGP(mol) | MolPGP | MolScreen.T... | Predict PGP II Permeability compound. a value >0.5 indicates high permeability, <0.5 indicates low permeability |
| MolPGP(mol) | MolPGP | MolScreen.T... | Predict PGP I Permeability compound. a value >0.5 indicates high probability of being a P-glycoprotein inhibitor/substrate |
| MolHenryLaw(mol) | MolHenryLa... | MolScreen.T... | Predict Henry's Law constant in atm/mol |
| MolVP(mol) | MolVP | MolScreen.T... | Predict Vapor Pressure in mmHg |
| Tox_Score(mol,publi...) | Tox_Score | Chemical | Predict Adverse Effect on Chemical suppliers and other sources. Tox\_Score >3 indicates substructure/threshold that is flagged as unfavorable. Tox\_Class >0.5 indicates toxic compound |
| LiverTox_Score | LiverTox_Score | Chemical | Predict Toxicity on Liver Drug Induced Liver Injury (DILI) Score. Range: 0-1. LiverToxScore(UseR, PubLi...)Score >0.5 indicates compound would likely cause liver toxicity or injury |
| Nephrotoxicity | Nephrotoxicity | Chemical | Predict Nephrotoxicity. Range: 0-1. Nephrotox >0.5 indicates compound would likely cause kidney toxicity or injury |
| CovalentProd_Group... | covalentProd... | Chemical | Potential chemical groups that can be linked covalently in compound |
`
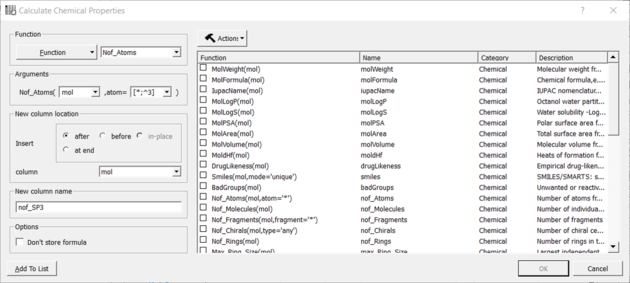
You can calculate the Number of Atoms using:
- Chemistry/Calculate Properties
- Choose the Function Chemical from the drop down list and then Nof_Atoms.
- Add the SMARTS string for the atoms you are trying to count (e.g. sp3 : [*;^3] halogen : X or [F,Cl,Br,I])
Nof SP3 example:
| Available in the following product(s): ICM-Chemist | ICM-Chemist-Pro | ICM-VLS |
The ToxScore gives a prediction for how reactive or toxic a chemical is.
How the ToxScore is Calculated
Around 1000 SMARTS strings associated with toxicity/reactivity were collected from various sources. They were assigned demerit score based on their perceived toxicity and frequency of appearance in approved drugs. The toxscore of any compound was calculated by summing up all the matching SMARTS strings. A toxscore >= 1. indicates likely toxicity based on substructure match.
How to Calculate ToxScore
- Read into ICM an SDF file. A chemical spreadsheet will be displayed in the GUI.
- insert a column into the chemical spreadsheet. Right click on a column header
>choose insert column>choose the chemical function>select Tox Score. - A column containing a Tox Score and Tox Names will be displayed.
- Read into ICM an SDF file. A chemical spreadsheet will be displayed in the GUI.
- Chemistry/Calculate Properties and choose the 'bbb' blood brain barrier
- A score will be displayed in a column in the SDF file. A score >4 indicates the chemical can pass the BBB
A reasonable cutoff between accessible and difficult is 0.5 - >0.5 is considered synthetically feasible.
LogD models is based on LogP and pKa most basic and most acidic groups (pKa_ma and pKa_mb)
LogD = LogP - Log( 1 + 10^(-7.4 + pKa_mb )) # for pKa_ma > 7.4 and pKa_mb exists LogD = LogP - Log( 1 + 10^( 7.4 - pKa_ma )) # for pKa_mb < 7.4 and pKa_ma exists LogD = LogP # for other cases
The PSA model is trained on diverse set of drug-like molecules with 3D conformations from Enamine HTS collection. (~200K of 3D conformations). Training values for PSA is averaged across multiple conformations per compound (calculated using ' show surface mute area' ICM command).
- Descriptors: ECFP4 - Model: PLS - Internal Cross Validation (leave 1/5 out) - Q2= 0.98, R2=0.99