| Prev | ICM User's Guide 16.3 Display Options | Next |
[ Pocket Surface | Ligand Surface | Hydrogen Atoms | Display Hbonds | Energy Circles | Pretty View | 2D Interactions | Unsatisfied Hydrogen Bonds | Display Relaxed Ligand | Visualize Ligand Strain | APF Field & Excluded Volume | Contacts | Center ]
| Available in the following product(s): ICM-Pro | ICM-VLS | ICM-Chemist-Pro |
Video |
16.3.1 Display the receptor pocket surface |
This option makes a surface based on the properties of the pocket.
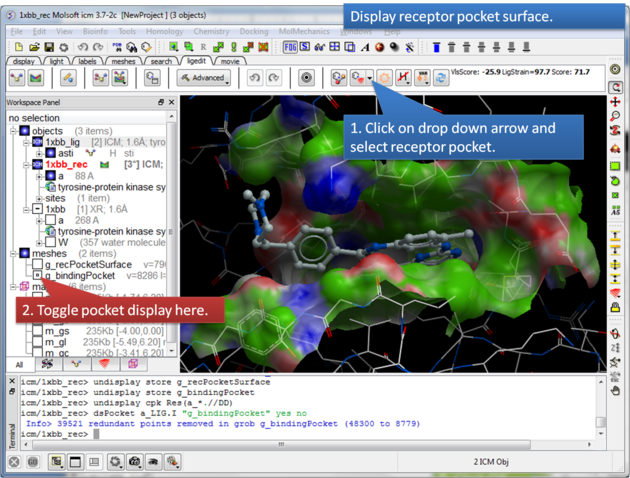
About the Receptor Pocket Surface: White=aromatic lipophilic, Green=non-aromatic other (mostly aliphatic) lipophilic surface, Red=hydrogen bonding acceptor potential, Blue=hydrogen bond donor potential
16.3.2 Display the ligand pocket surface |
The Ligand Surface option allows you to visualize cavities that are open for ligand modifications.
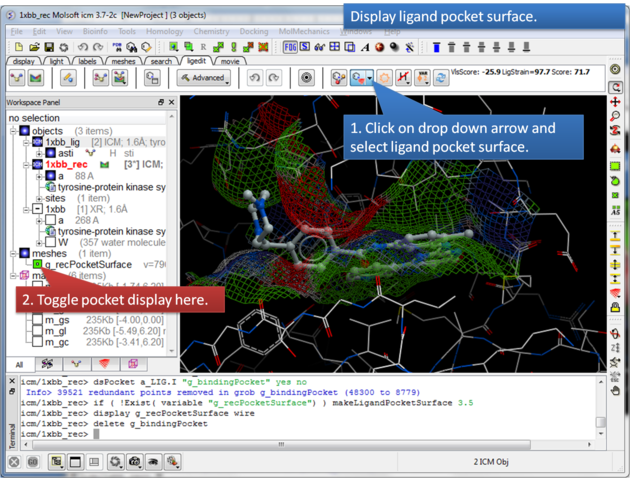
About the Ligand Pocket Surface: White=aromatic lipophilic, Green=non-aromatic other (mostly aliphatic) lipophilic surface, Red=hydrogen bonding acceptor potential, Blue=hydrogen bond donor potential
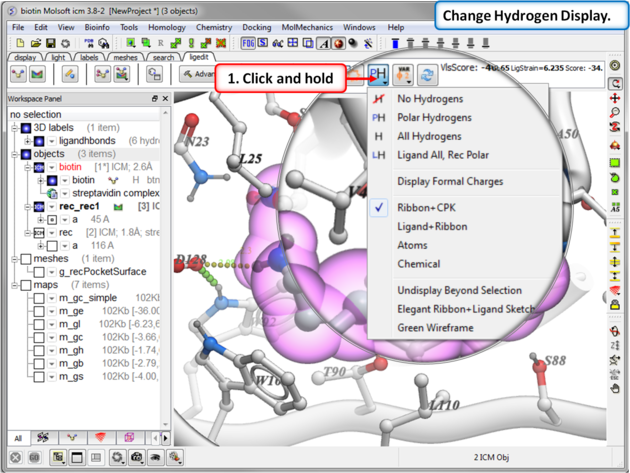
16.3.3 Display Hydrogen Atoms |
To display hydrogen atoms:
- Single click on the hydrogen atom display button will toggle the display between: no hydrogens, polar hydrogens, all hydrogens, all hydrogens in ligand and polar hydrgens in receptor.
- Click and hold on the button and you can choose the option rather than using the toggle.
16.3.4 Display Hydrogen Bonds |
To display hydrogen bonds:
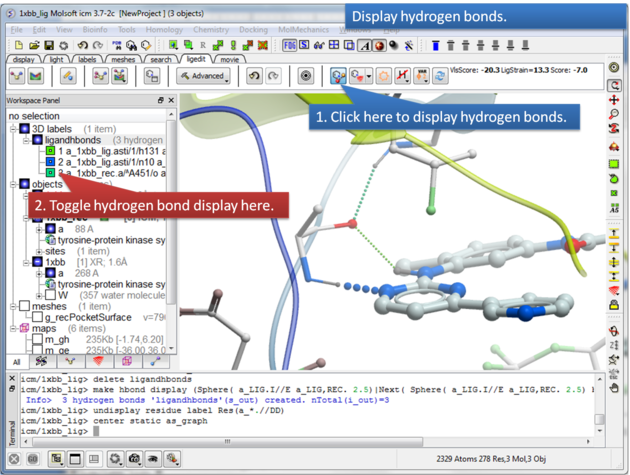
About Hydrogen Bonds: The coloring of the H-bonds are red (strong - thick spheres) to green (intermediate) to blue (weak - thin spheres). Once the hydrogen bonds have been displayed they can be displayed and undisplayed in the 3D labels section of the ICM Workspace (left hand side of graphical window).
16.3.5 Display Atomic Energy Circles |
To display atomic energy circles:
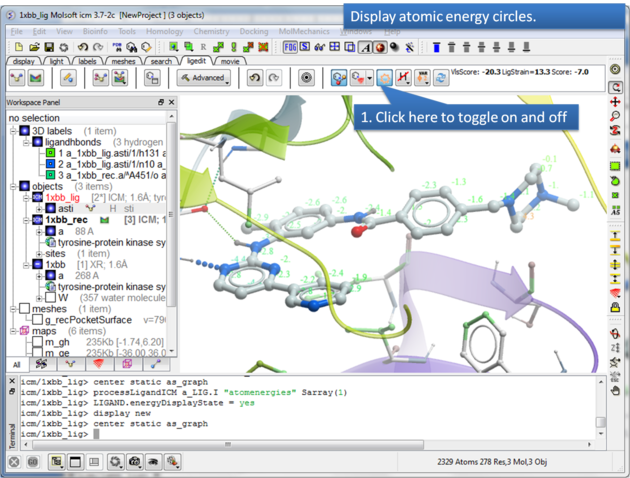
About the Atomic Energy Circles: Good ligand-receptor interactions are highlighted by green spheres and low values. Poor energy interactions are displayed as orange-->red stars - red being a major clash and a very poor energy contribution. Each atom is given an energy value relating to its contribution to the total receptor-ligand interaction energy. Low values colored green are considered favorable. The green values on each atom are per-atom contribution to the total energy in the receptor grid ('show energy atom' command). The score/energy can not be partitioned into per-atomic contributions because several terms/contributions are not pairwise (in particular solvation-related, as well as the strain). However, grid-based approximate interaction energy is calculated per-atom and reflects, to an extent, favorable/unfavorable contributions from things like van der waals, hydrogen bonds, coulomb part of electrostatics and some approximation of lipophilicity.
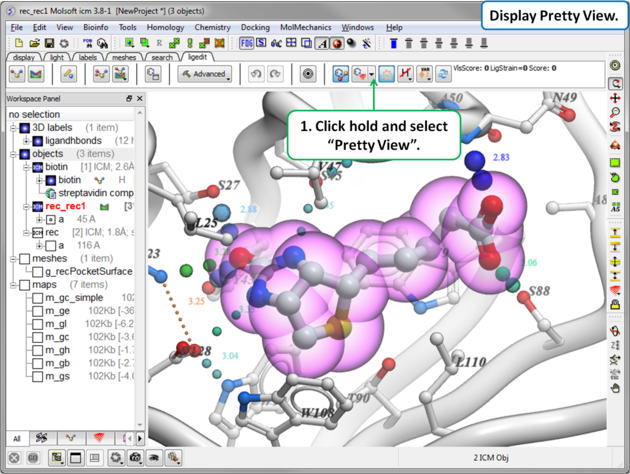
16.3.6 Display Pretty View |
To display the default "Pretty View":
 |
|
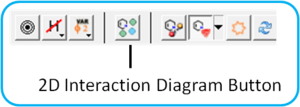
16.3.7 2D Interaction Diagram |
To create a 2D interaction diagram - click on the 2D interaction diagram button shown below. More details regarding this option can be found here.
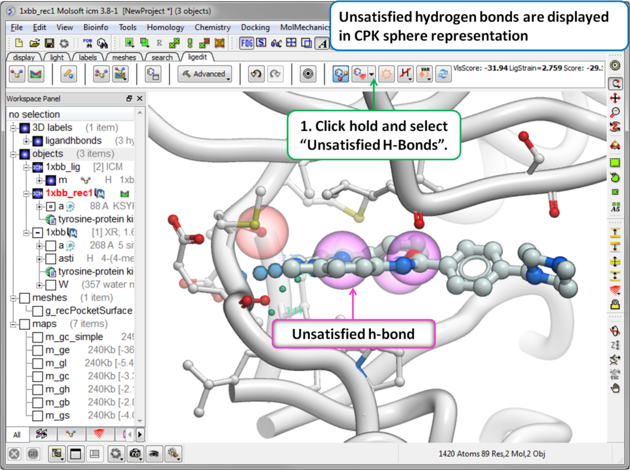
16.3.8 Unsatisfied Hydrogen Bonds |
To display unsatisfied hydrogen bonds:
 |
|
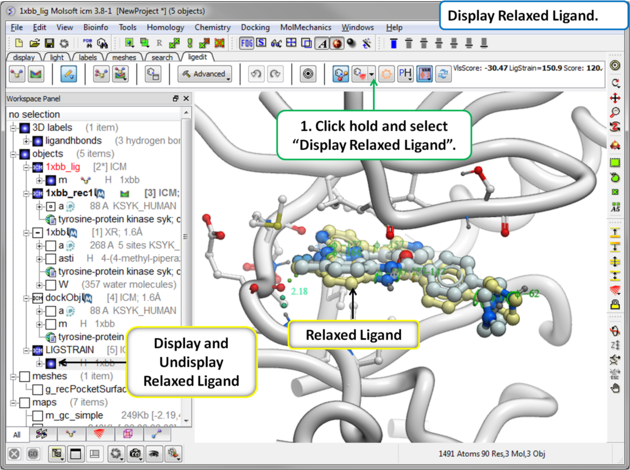
16.3.9 Display Relaxed Ligand |
The relaxed ligand is is the closest local minimum after minimization in the Merck Molecular Force Field (MMFF) outside of the receptor.
To display the relaxed ligand:
 |
|
16.3.10 Visualize Ligand Strain |
If you are seeing a high ligand strain value when you calculate the score you can visualize the cause of this by viewing the variable angles.
To view the variable angles:
- Click on the variable angle button in the ligand editor tool panel.
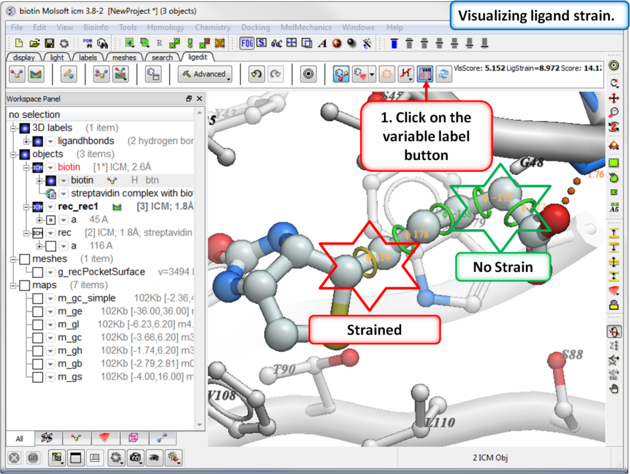
Rings of varying diameter and color are superimposed on rotatable bonds. Green rings with large diameter are considered less constrained than rings with small green/yellow/red rings. Red rings are highly constrained. You can also compare your strained ligand with the relaxed ligand.
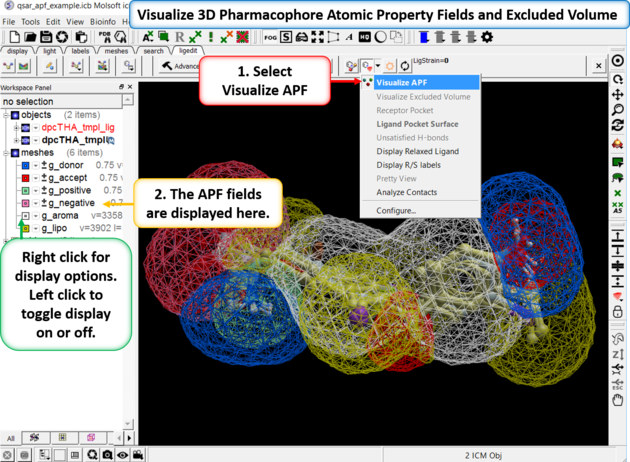
16.3.11 Visualize APF Field and Excluded Volume |
If you are docking to Atomic Property Fields (APF - 3D Pharmacophore) as described here you can visualize the APF fields. Click on the button shown below and choose Visualize APF. The fields will be displayed and they can be toggled on and off in the ICM workspace - right click in the display box in the ICM workspace to change the surface display (e.g from mesh to transparent surface).
APF is a ligand based method but you can use a protein structure to represent an excluded volume - if you chose this option when performing APF docking then you can display the excluded volume.
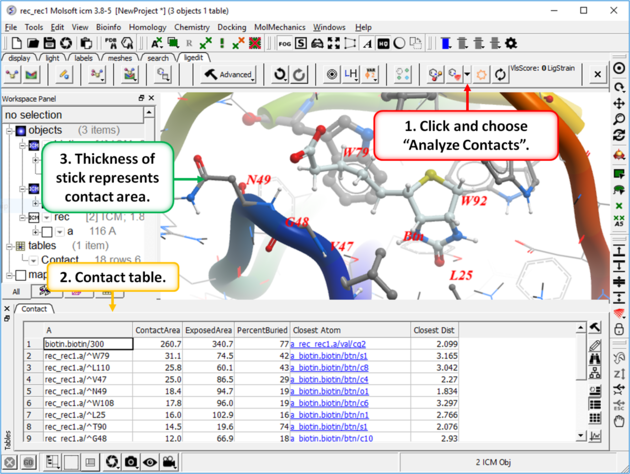
16.3.12 Identify Ligand-Receptor Contacts |
To display ligand-receptor contacts:
- Click on the button shown below.
- Select "Analyze Contacts".
- The xstick display in the region will be scaled according to the atom/residue contact area. For example residues making large contacts with a ligand will be displayed in thicker xstick representation (and colored yellow) than those making less significant contacts.
- A table as shown below will be displayed.The table lists the contact area, exposed area, percentage of contact area compared to exposed, the nearest atom of a residue and the distance.
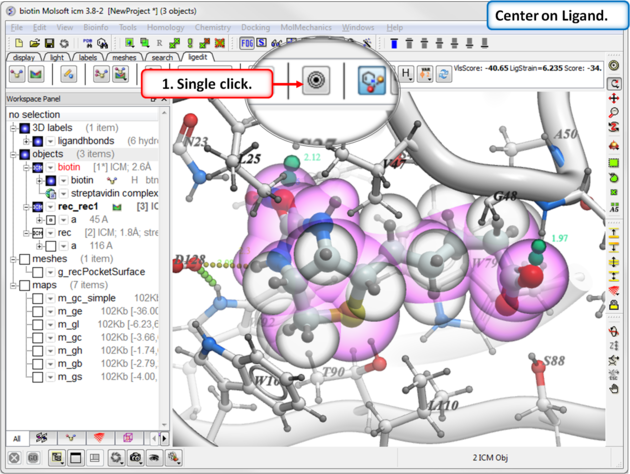
16.3.13 Center on Ligand |
To center on a ligand in the graphical display:
- Click on the center button in the ligedit tab.
| Prev Preferences | Home Up | Next Score and Strain |