| Prev | ICM User's Guide 16.9 Dock or Minimize Ligand | Next |
[ Expand Pocket ]
| Available in the following product(s): ICM-Pro | ICM-VLS | ICM-Chemist-Pro |
Video |
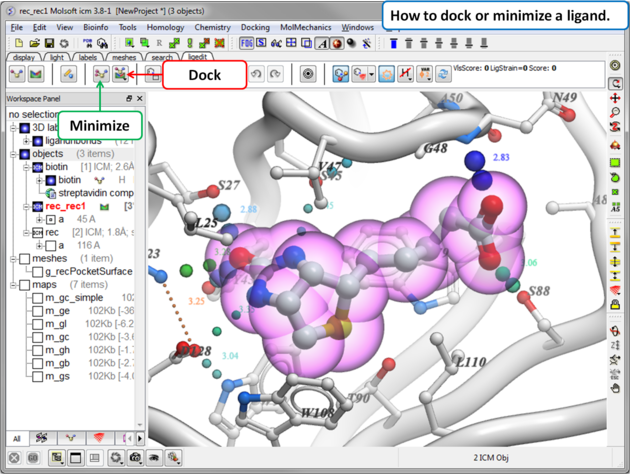
How to Dock or Minimize a Ligand in the Grid maps:
 |
|
If you dock a chemical spreadsheet will be displayed with the docking results. Use the check box in column 'L' to display the docked ligand or double click to load the ligand into the ligand editor.
A guide to the table columns:
- LE_Score The lower the Score the better the predicted interaction.
- RTCNN (Radial Topological Convolutional Neural Net) - you can read more about this score here. The lower the better the predicted interaction.
- Strain: The strain of the ligand. Lower values = less strain. (kcal/mol)
- Steric: Is the van der Waals interaction energy (sum of gc and gh van der waals). Current version of the score uses explicit van der Waals interaction energy calculation (no grids). (lower the better)
- Torsion: Number of torsions in ligand
- Electro: is the solvation electrostatics energy change upon binding (lower the better)
- Hbond: is Hydrogen Bond energy - (lower the better)
- Hydroph is the hydrophobic energy in exposing a surface to water (lower the better)
- Surface is the desolvation of exposed h-bond donors and acceptors (lower the better)
Once docked you can toggle the docked ligand display on or off using the "L" column in the hitlist or you can load the docked chemical into the receptor for modification:
- Display the pose over the current ligand. Single click on the box in 'L' column will display the pose without loading the ligand for editing.
- Load the pose as a current ligand. Double-click in any cell of the row except the box in 'L' column. That should load the ligand so you can editor it further.
How to undertake an all-atom minimization in Cartesian coordinates:
- Note this option is available in ICM 3.8-4 and higher.
- Click and hold on the Minimize button.
- Choose Minimize in Receptor.
16.9.1 Change the Size of the Docking Region |
How to change the size of the docking region:
The purple box represents the region in which the energy maps are generated. If you want to change the size of this region you can do so by displaying the box (go to Advanced menu) and clicking and dragging on the corners of the purple box. The maps will then be remade on the fly.
| Prev Bioisostere Scan | Home Up | Next Dock Table |