| Prev | ICM User's Guide 11.4 Get Electron Density Map | Next |
Theory
An electron density map is a representation of a crystal structure based on the diffraction data. The map is constructed by a summation of waves of known phase, amplitude and frequency using Fourier transform. The electron density map of a protein can be viewed along with the pdb structure. The easiest way to view the electron density map is to contour and convert it into a graphical object (mesh).
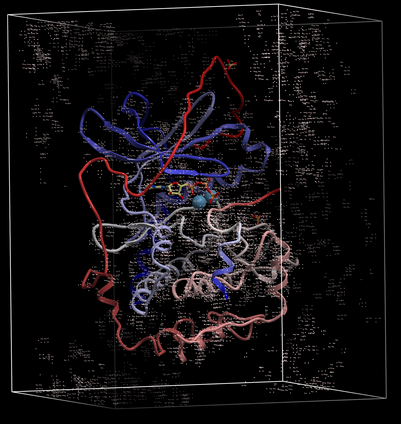
A figure showing the electron density contours surrounding the ATP molecule in pdb entry 1ATP.

To load an electron density map:
- Tools/Xray/Get Electron Density Map
- Enter the PDB code of the map you would like to view.
- Click OK and the map will be downloaded from the Uppsala Electron Density Server.
The map will be represented in the ICM Workspace as shown below.
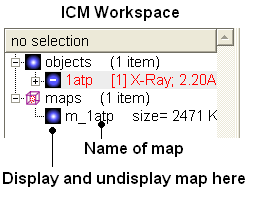
The map can be displayed as shown below however a clearer way of representing the density is to contour the map into a graphical object (mesh) as described in the following section.
| Prev Biomolecule Generator | Home Up | Next Map's Original cell |