| Prev | ICM User's Guide 19.5 Learn and Predict | Next |
[ Learn | Predict | Theory | Clustering ]
Partial Least Squares (PLS) and Principal Components are commonly used methods which are implemented in ICM to predict compound properties or any other variable. There are many tutorials in the web available for free download. For the details of ICM implementation and the explanation of our terminolgy see the theory section below.
In order to perform 'learn and predict' in ICM information must be stored in a table, molecular table or csv file. See the tables chapter for more information on ICM tables. Both chemical compounds and numeric data can be source for building prediction models.
All molecular property predictors are calculated using fragment-based contributions. We developed an original method for splitting a molecule into a set of linear or non-linear fragments of different length and representation levels and then each chemical pattern found is converted into a descriptor.
19.5.1 Learn |
First load in a table of data on which you wish to perform the learn and predict functions. See the tables chapter for more information on ICM tables.
- Select Tools/Table/Learn and a window as shown below will be displayed. Or use the Chemistry/Build Prediction Model option.
- Enter the name of table with which you want to perform the predictions. You may locate your table from the drop down arrow menu.
- Select the column from which you wish to learn. Use the drop down arrow to select.
NOTE If the table does not contain any numeric (integer or real) columns, there is nothing to predict, so the "Learn" button will be disabled. - Enter a name for the learn model.
- Select which regression method you wish to use from the drop down menu. See the theory section to determine which method and parameters to use.
- Select which columns (descriptors) of your table you wish to use to 'learn'.
- If you are using chemical descriptors to produce your model select the maximal chain length.
- Select the number of cross-validation groups you wish to use or selected rows can be used for cross validation. The number of iterations will impact the speed of the calculation. 5 is the default number of groups but 2 would be the least rigorous and selecting the 'Leave-1-out' would be the most rigorous calculation.
- Click on the learn button and a table summarizing your model will be displayed as shown below.
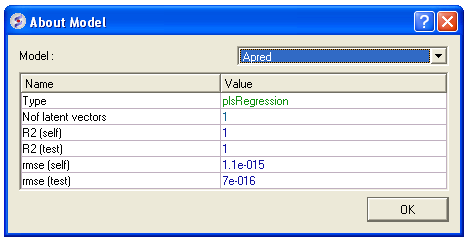
- Click OK and this table will be removed.
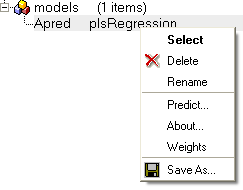
All models are then stored in the ICM workspace as shown below. A number of options are displayed in the right click menu.
19.5.2 Predict |
To make a prediction using a created model.
Read the table of data into ICM from which you wish to predict. Make sure the table contains the same columns used for the learn model.
- Tools/Table/Predict or Chemistry/Predict
- Select which table you wish to make the prediction on.
- Select which model you wish to use.
- Check that the required columns are in the table. If they are absent a red mark will appear against the column that is missing.
- Click Predict.
19.5.3 A little theory on learning |
For a more detailed explanation of the theory behind Partial Least Squares (PLS) we suggest you read Geladi et al Analytica Chimica Acta (1986) 1-17.
PLS (Partial Least Squares) Regression PLS regression algorithm builds linear prediction model: in format y=(w,x)+b, where b is the bias - a real number, and w is the weights vector, which is scalarly multiplied by the data vector x. PLS uses the given learning y values very actively which allows it to produce fairly good models with respect to constraint of being linear. Although linear regression models have an advantage of weights for each descriptor which gives a useful information and allows feature selection in many cases.
The linear model simply is not able to predict higher order dependencies.
There are different ways to deal with it. By adding the second order columns into the descriptor set you can let PLS predict them. Actually if you have a lot of columns derived from basic data, the linear model built will be able to make a high-quality linear approximations of the actual functions. ICM has a powerful tool for automatical generation of such descriptors based on compound data -- molecule fingerprints generation algorithm. It generates hundreds of columns based on initial data. The withdraw is that analysing the weights given by PLS to generated descriptors is almost senseless. You will need a mol column in your table to use this feature.
ICM has built-in models for prediction of several significant molecule properties, like logP, logS, PSA based on fingerprints+PLS symbiosis, which have proven their quality.
PC (Principal Component) Regression
PCR also builds linear model in its simplest form, as PLS does, though it sets other weights to descriptors, and built models are usually worse in sense of predicting, because PCR uses value information of the training data only in secondary way. We recommend you to use PCR, when you want to build an ordinary regression (MLR - Multiple Linear Regression) model by using only some number of first principal components of X data matrix (ordered by decreasing eigenvalues) or even builing the full MLR model (by setting the number of PCs to value higher than the number of rows in matrix).
19.5.4 Data Clustering |
ICM allows you to create hierarchical clusters for chemical and other objects. Cluster trees can be used for:
- Navigation through large data sets.
- Selecting group representatives (taxons).
- Filtering tables to exclude redundancy.
- Finding similar elements, and more.
- Creating hierarchical views of data sets in many different styles, with subsequent image export/printing ability.
| Prev PCA | Home Up | Next Cluster |