| Prev | 4.4 How to Display Hydrogen Bonds | Next |
| NOTE: The method by which hydrogen bonds are calculated is described here in the command line manual. The GRAPHICS.hbondMinStrength parameter determines the hbond strength threshold for hbond display. The strength value is between 0. and 2. By changing 1. to 0.2 you will see more weak hydrogen bonds. |
- As an example we will use the PDB structure 1STP. Type 1STP in the pdb search tab and press return.
- In order to display energy related properties we need to convert the PDB file into an ICM object. Convert 1STP into an ICM object. In this example, the option "Replace the Original" was selected.
- Display the receptor in wire format and the ligand in xstick.
- Right click on the ligand and select "Neighbors" - Enter 3 Angstroms and Type = Visible. Do not exclude source (the ligand) therefore remove tick from box entitled "exclude source".
- Select the display tab and then select the Display H-Bond button.
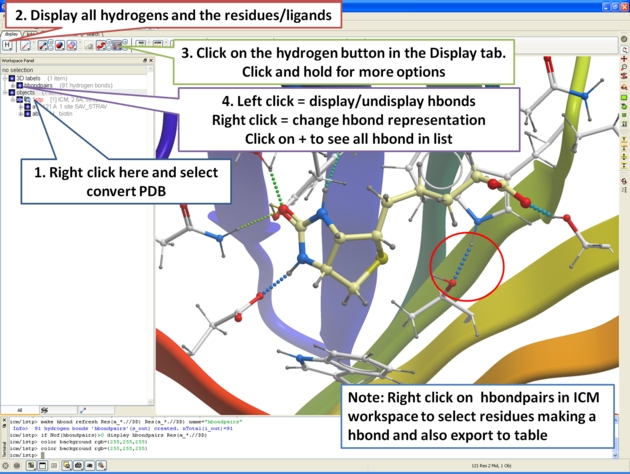
| NOTE: Different options for displaying the H-bond can be accessed by clicking and holding on the H-bond button in the "Display" tab. The coloring of the H-bonds are red (strong - thick spheres) to blue (weak - thin spheres). Once the hydrogen bonds have been displayed they can be displayed and undisplayed in the 3D labels section of the ICM Workspace (left hand side of graphical window). |
| Prev Pocket Surface | Home Up | Next Search PDB |