| Prev | ICM User's Guide 18.3 Pocket Display Options | Next |
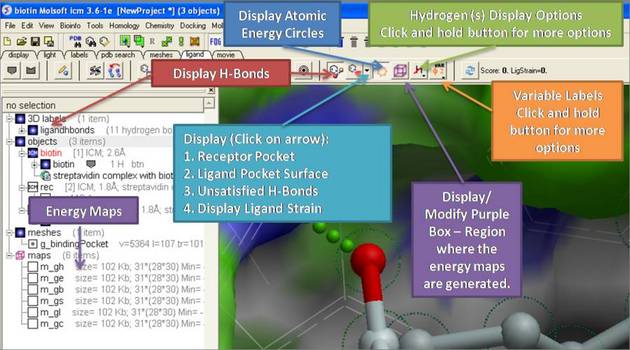
Our first step is to display the binding pocket property surface, ligand and receptor hydrogen bonds, and atomic energy circles. To do this click on the buttons highlighted below. You can also select to display or undisplay hydrogens and variable labels. During the ligand editing process these display options are very useful to guide your ligand design.

About Hydrogen Bonds: The coloring of the H-bonds are red (strong - thick spheres) to blue (weak - thin spheres). Once the hydrogen bonds have been displayed they can be displayed and undisplayed in the 3D labels section of the ICM Workspace (left hand side of graphical window).
About the Receptor and Ligand Pocket Surface: White=neutral surface Green=hydrophobic surface Red=hydrogen bonding acceptor potential Blue=hydrogen bond donor potential
About the Atomic Energy Circles: Good ligand-receptor interactions are highlighted by green spheres. Poor energy interactions are displayed as orange-->red stars - red being a major clash and a very poor energy contribution. Each stom is given an energy value relating to its contribution to the total receptor-ligand interaction energy. Low values colored green are considered favorable.
@About Purple Box The purple box represents the region in which the energy maps are generated. If you want to change the size of this region you can do so by clicking and dragging on the corners of the puprle box. You will then have to remake the maps by re-clicking the display/modify pocket box.
| Prev Preferences | Home Up | Next Re-Dock |