| Prev | ICM User's Guide 17.4 Virtual Ligand Screening | Next |
[ VLS Intro | Start | Database Format | Preferences | Run VLS in the Graphical User Interface | PBS | Parallelization | VLS Results | Sort Hitlist | Plot | Histogram | Scatterplot ]
Virtual Ligand Screening can be used for screening as many compounds as you desire depending on the amount of computer power you have available. ICM-VLS has been successfully used by the pharmaceutical industry and academia for identifing drugs and inhibitors for a wide variety of disease.
17.4.1 Virtual Ligand Screening |
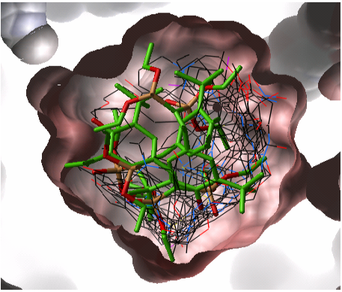
Virtual Ligand Screening (VLS) in ICM is performed by docking a database of ligands to a receptor structure followed by an evaluation of the docked conformation with a binding-score function. Best-scoring ligands are then stored in the multiple icm-object file. The set-up of the VLS process is largely identical to the set-up for the small molecule docking simulation (see Small Molecule Docking section).
17.4.2 VLS Getting Started |
Follow the instructions in the small molecule docking section manual from docking project setup option to the calculate maps option. Use Docking/Setup Batch Ligand option to select the database you wish to dock.
17.4.3 Database File Format |
In most cases the ligand input file will be an SDF or MOL2 file. These files need to be indexed by ICM before they can be used in VLS runs. The index is used to allow fast access to an arbitrary molecular record in a large file such as an SDF file which in some cases contains over one million compounds.
To index an sdf file:
- Click on the menu Docking/Tools/Index Mol/Mol2 File/Database to generate the index. The following data entry box will be displayed.
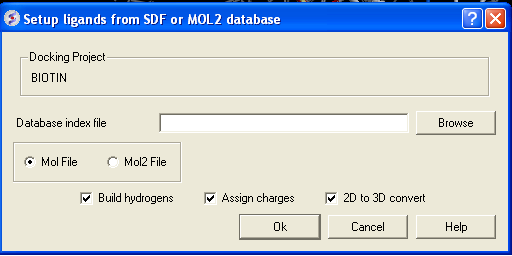
- Enter the name of your Mol/Mol2 file and enter the name you wish to call your index file.
- Select whether your file is in Mol or Mol2 format.
17.4.4 VLS Preferences |
| NOTE: It is important to setup the VLS preferences before undertaking VLS run. |
VLS preferences can be setup by:
- Selecting the menu Docking/Preferences/Database Scan
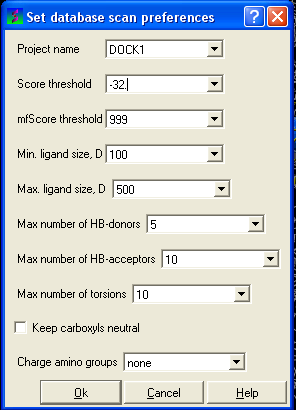
Different options are available to select by clicking the down arrow next to the data entry field. These options are described here:
Score Threshold:
An important parameter of the VLS run is the score threshold. Docked conformations for a particular ligand will only be stored by ICM VLS procedure if its binding-score is below the threshold. The choice of the threshold can be done in two ways: based on the scores calculated by docking known ligands. Generally, a value somewhat above typical score observed for known ligands is a good guess. If no ligands are known, a pre-simulation can be run using ~1000 compounds from the target database. Using the resulting statistics for the scores, the threshold should be set to retain ~1% of the ligands.
Potential of mean force score:
Potential of mean force calculation ( pmf ) provides an independent score of the strength of ligand-receptor interaction. The pmf-parameters are stored in the icm.pmf file.
Other selection criteria:
Other selection criteria which can be changed include
Minimum/Maximum Ligand Size you wish to be screened.
Maximum number of H-bond donors
Maximum number of H-bond acceptors
Maximum number of torsions
17.4.5 Run VLS in the Graphical User Interface |
First setup the docking project (From Set Project to Setup Batch Ligand)
To start the vls job:
- Docking/Run Docking Batch
17.4.6 Running VLS Jobs in PBS UNIX Cluster Environment |
Before VLS jobs can be run make sure you follow the instructions in the manual entitled Small Molecule Docking from docking project setup menu to the calculate maps menu. Select the "From indexed database", "From MolCart" or "From File: SDF/Mol2" option in the Setup Batch Ligand. Docking setup can be scripted see the terminal output from the GUI options to view the commands. Jobs on the Linux cluster are run through PBS queuing system. Several scripts are provided to facilitate submission of vls jobs. To submit a single job, use pbs script 'pbsrun', which is a pbs wrapper for rundock qsub $ICMHOME/pbsrun -v"JOBARGS=-f 1 -t 1000 -o MYPROJECT"
| NOTE: The rundock arguments go in the quotes after JOBARGS= . The qsub command is a part of PBS. |
Other rundock arguments are:
-l
-L
-n
-a # force docking and saving of all compounds
-s # save stack conformations
-j
-o # redirect output to
To submit multiple jobs, there is a simple shell script 'pbsscan' which executes multiple qsub's for database stripes:
$ICMHOME/pbsscan MYPROJECT 1 6000 1000
-submits 6 jobs, 1 to 1000; 1001 to 2000 ... 5001 to 6000. Currently this script only supports default rundock arguments, copy/edit to change.
The command qstat is a part of PBS and can be used to check the status of the jobs. In addition, $ICMHOME/scanstat script can be used to monitor the progress of the VLS jobs. It analyses the *.ou rundock output files.
$ICMHOME/scanstat *.ou
To delete the jobs, use PBS command qdel:
qdel 1234 # deletes job number 1234
If the database size exceeds several thousand compounds, it is desirable to run a number of VLS jobs in parallel to speed up calculations. Use -f and -t options of rundock to start multiple jobs on different parts of the database, e.g.
rundock -f 1 -t 10000 -o
rundock -f 10001 -t 20000 -o
rundock -f 20001 -t 30000 -o
..
The easiest way to view the results of a VLS run is to make a hitlist. This was described earlier in the hitlist section of the small molecule docking chapter of the manual. Other ways of manipulating VLS data are described here:
Compounds can be sorted according to their SCORE etc. See the tables section of this manual for
more information about manipulating tables.
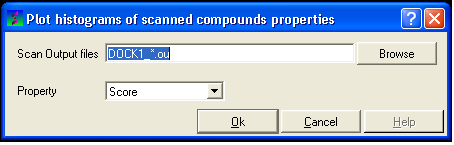
The hitlist contains many columns with numerical data. ICM can build interactive plots
with the table columns (See Tables section). However, there are some easy to use plotting options
in the docking menu which is described here.
17.4.7 Parallelization
17.4.8 VLS Results
17.4.9 Sorting the compounds in your HITLIST
17.4.10 How to Plot Histograms and Scatterplots of VLS Data
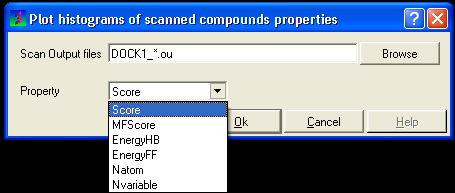
17.4.11 To construct a histogram of your VLS data
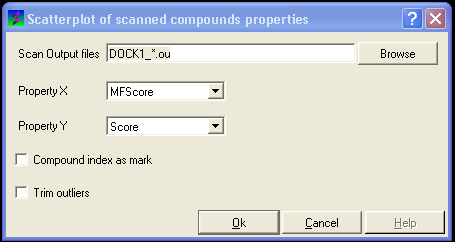
17.4.12 To construct a scatterplot of your VLS data
Prev
Template DockingHome
UpNext
Autofit