[ Consensus Pharmacophore | Pairwise APF Score | APF Ligand Based Screen | 3D QSAR ]
| Available in the following product(s): ICM-Chemist-Pro | ICM-VLS |
The Atomic Property Fields (APF) superposition/alignment method was first reported by Maxim Totrov PhD (Principal Scientist - MolSoft) at the 2007 233rd American Chemical Society National Meeting, Chicago, IL USA and then published here. This section shows you how to:
- Generate a consensus pharmacophore from the APF fields.
- Calculate a pairwise APF score.
- Perform ligand-based screening using APF fields.
To generate a Consensus Pharmacophore based on APF fields use the Chemistry/APF Tools/Consensus Ph4 menu option.
First convert your chemical into an ICM object.
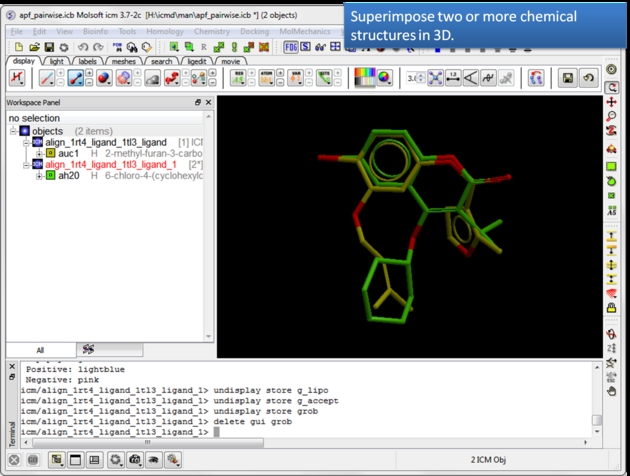 |
| Load and display two or more superimposed chemicals. You can superimpose the chemcials using APF fields as described here or using substructure superposition. |
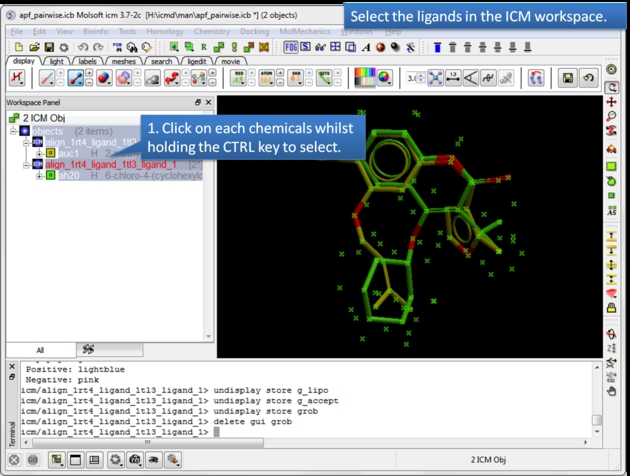 |
| Select the ligands. You can select the ligands by clicking on them in the ICM workspace whilst holding down the CTRL key. Alternative selection modes are described here. |
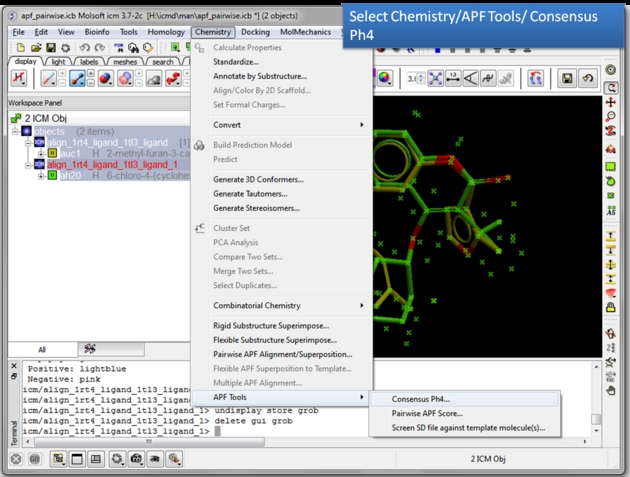 |
| Choose the Consensus Ph4 menu option. Chemistry/APF tools/Consensus Ph4. |
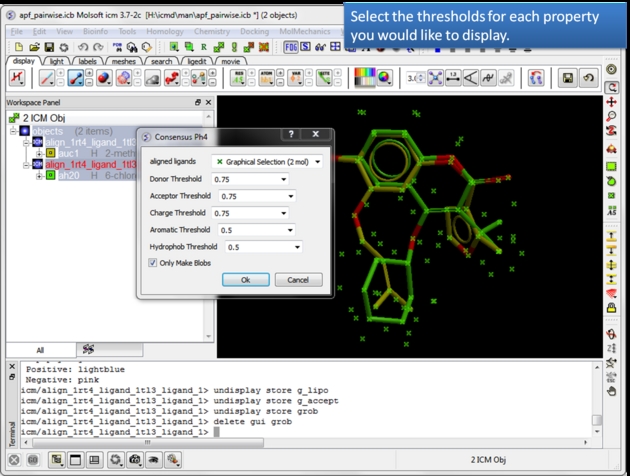 |
| Select the threshold for each property. For example, if the setting is 0.75 then the pharmacophore will be displayed if the property is found in 75% or more of the ligands. |
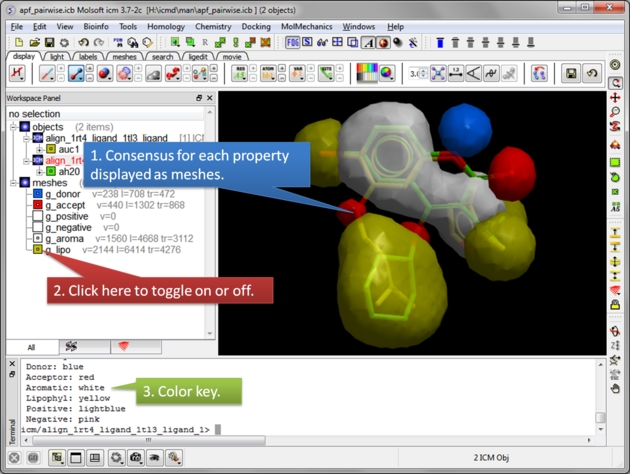 |
| Consensus is displayed as meshes. Each mesh can be displayed or undisplay in the ICM workspace. |
To determine how well the APF fields of two chemicals match you can determine the Pairwise APF Score using the Chemistry/APF Tools/Pairwise APF Score menu option.
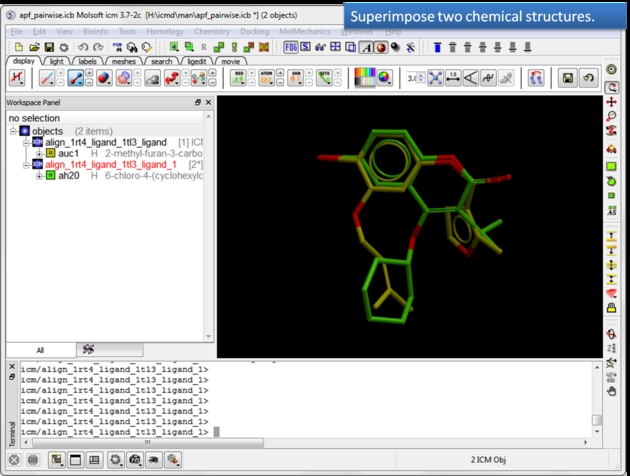 |
| Load and display two superimposed chemicals. You can superimpose the chemicals using APF fields as described here. |
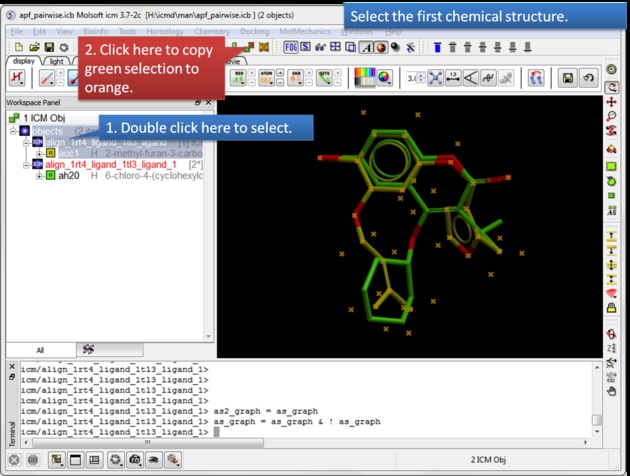 |
| Select the first chemical. Use the green selection to orange button to select the first chemical. |
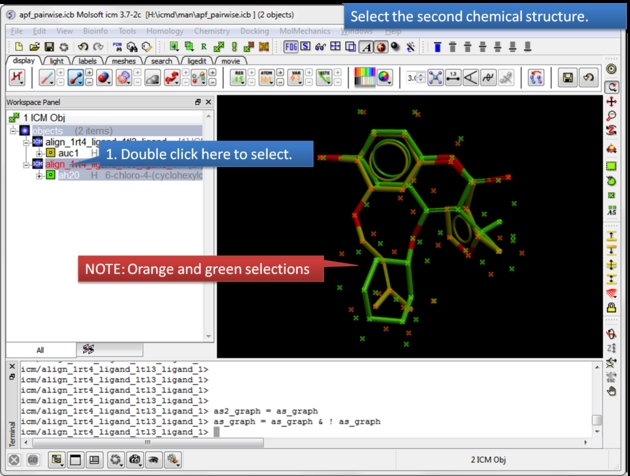 |
| Select the second chemical. Double click the chemical in the ICM workspace to select it. |
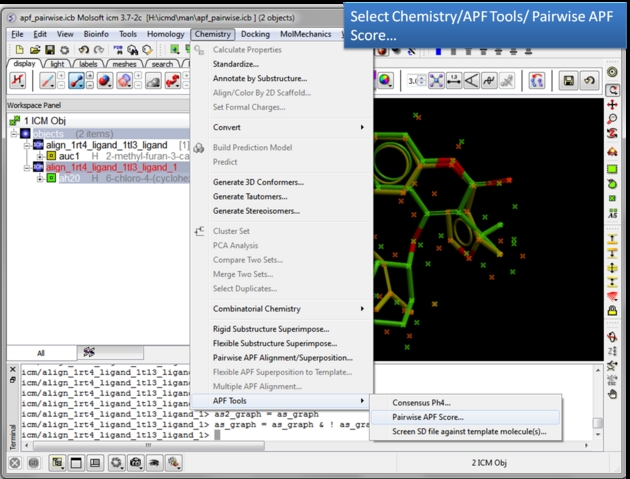 |
| Choose the Pairwise APF Score menu option. Chemistry/APF tools/Pairwise APF Score |
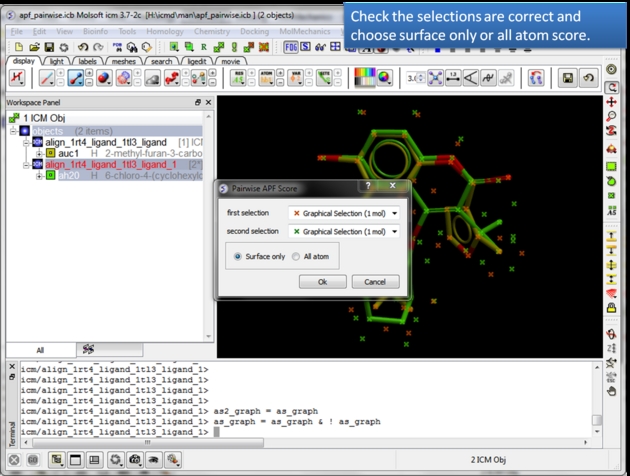 |
| Check the selections are correct. Choose whether you wish to calculate the score based on all atoms or just the surface atoms. |
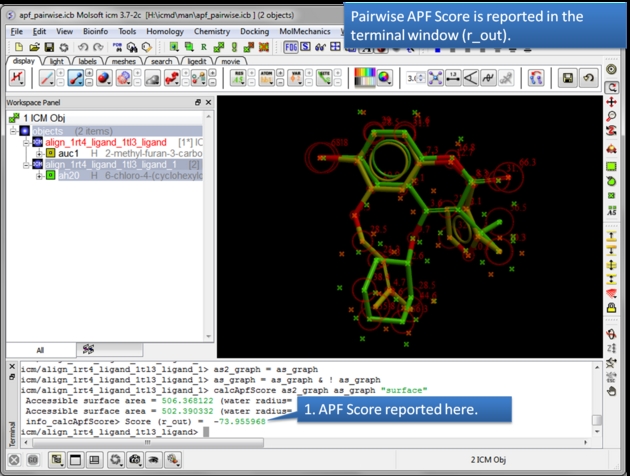 |
| The APF Pairwise Score is displayed in the terminal window. The score is also returned to r_out. Do not see the Terminal window? Go to Windows menu and check the Terminal box. |
This option allows you to perform a ligand-based screen using the Atomic Property Fields of superimposed chemicals. SD files are screened and the ligands are scored according to their fit into the APF field. The documentation for this option is in the Screening Chapter.
| Tutorial|
This 3D QSAR approach uses MolSoft's Atomic Property Fields 3D pharmacophores as described in this paper.
APF 3D QSAR
Atomic Property Field (APF) 3D QSAR is a method for predicting the biological activity of molecules based on their spatial atomic properties. Unlike traditional QSAR approaches, APF captures the 3D distribution of molecular features to improve prediction accuracy.
Modeling Molecular Activity
The contribution of different molecular fragments to the APF model is weighted, allowing for a quantitative prediction of new molecules. This is expressed mathematically in Equation 3. By incorporating specific weight factors, the model refines activity predictions beyond a simple additive approach, ensuring that the molecular properties are accurately represented in a biologically relevant context. These weight factors are optimized based on experimental data, leading to a more precise predictive model.
Linking to Binding Energy
To predict the binding energy (ΔG), the APF pseudo-energy is used to approximate the actual binding energy, as shown in Equation 4. This approach allows for a rapid assessment of molecular interactions by correlating APF-derived energy values with experimentally determined binding affinities. The pseudo-energy calculation considers molecular shape, electrostatic properties, and steric effects, ensuring a comprehensive representation of binding potential.
Summary of APF 3D QSAR
In the superposition and virtual ligand screening (VLS) procedures, the original APF model assigned equal weights to all ligands in the training set. However, to enable quantitative activity prediction, individual weight factors (xki) are introduced for each compound and APF component. These weights are optimized using training set activity data to better reproduce experimental results (see Equation 3).
To estimate a compound's binding energy, the APF pseudo-energy is calculated, assuming it approximates the actual binding energy (see Equation 4). By substituting the APF model into this equation, the summation order is rearranged to introduce partial APF energy components (Ekli), which simplify the calculation (see Equation 5).
The optimal weights (xki) are determined using a partial least squares (PLS) regression approach, where a matrix of pre-calculated APF potentials is used. The leave-one-out cross-validation technique ensures the selection of the best number of latent variables. Once derived, these weights are applied to combine per-compound potentials into a single weighted APF QSAR model, allowing for rapid activity prediction of new compounds through a single pseudo-energy calculation.
There are three steps to undertake APF 3D QSAR:Step 1: Chemical Superposition
- The APF 3D QSAR method relies on a set of superimposed chemicals. You can superimpose chemicals using the tools here. The 3D chemicals in the ICM workspace then need to be extracted to a chemical spreadsheet as described here. Both the chemicals used for training and the chemicals that you wish to predict need to be superimposed. Learn how to split your data into a test set and training set here. It is usually recommended to Convert the IC50 to pIC50 (-LogIC50)
Step 2: Learning
- Use the chemical table containing the superimposed chemicals (Step 1). This table should contain a mol column and a column containing activity data.
- Chemistry/APF Tools/APF 3D QSAR and select the learn tab.
- Choose the name of the chemical table from the drop down list.
- Choose the column containing the activity data.
- The statistics related to the model can be seen in the model section of the ICM workspace - left hand side.
- A table called BASIS will be created containing a column with the predicted value and cross-predicted value for each element of the training set.
Step 3: Prediction
- Read in a chemical table containing data you wish to predict. The column formats must match the model table and the chemicals must be superimposed on the training set (See Step 1).
- Chemistry/APF Tools/APF 3D QSAR/ and select the predict tab.
- Enter the name of the chemical table you wish to predict along with the activity column name.
- The table will be appended with a prediction column called MolApfQsar.
- The model will be saved in the ICM workspace and can be run on other chemicals that are superimposed with the training set.
| NOTE: The prediction model might be improved by removing some chemicals from the superposition in Step 1. It might be a subjective call as to which chemicals are good for the model and which ones should be removed. In some cases a crystal structure of a protein-ligand complex is available and the ligand pose would be a good template to superimpose onto. |
After running the model there are some additional visualization options located in the tabs in Chemistry/APF Tools/APF 3D QSAR/.
- You can display how the seven APF fields contribute to the model (Visualize Fields tab). 3D fields are functions of 3D coordinates and field magnitude would be a fourth dimension. Since we can not perceive more than 3 dimensions, the way you can analyze 3D fields is by contouring, e.g. visualizing limits of regions where the field is higher (or lower) than a threshold. The blobs delimit the regions in space that the model perceives as favorable or unfavorable for the presence of a particular pharmacophore property type atoms. The blob size does not necessarily reflect magnitude, although bigger blobs may (or may not) contain sub-regions of higher field magnitude. It can give you an idea where the model "likes" to see, say, hydrogen bond donors, acceptors, or positive and negative charges.
- You can visualize atom contribution to the model using the Visualize Atom Contribution tab.