[ MCS Dendrogram | Self Organized Network ]
There are two options to visualize chemical space:
The MCS method is K-greedy algorithm which simultaneously grows K different common substructures applying scoring and resorting on each step.
To display the interactive MCS dendrogram:
- Read in a chemical spreadsheet.
- Chemistry/Visualize Chemical Space/MCS Dendrogram
- Enter the name of the table you wish to analyze.
- Enter the name of the column you wish to use to label the points in the dendrogram.
- Choose Optimize MCS to minimize overlapping by branches in the tree.
- Click OK and the dendrogram will be displayed on the right hand side panel.
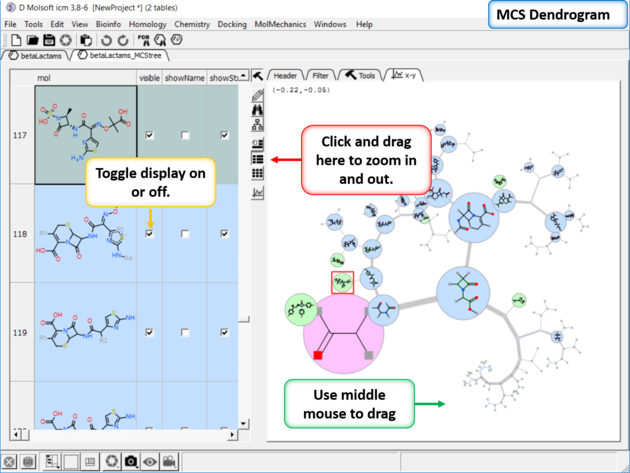
You can display and undisplay the points and labels by using the check boxes in the columns "visible", "showName" and "showStr". You can right click on the column and choose (un)check all. Points in the dendrogram are fully interactive and linked to the table. You can zoom and translate the plot around the space. The points are colored by > blue = common substructure, green = original compounds pink = root (most common)
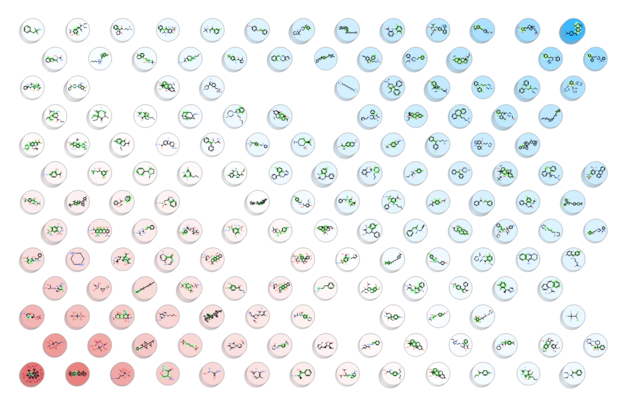
A Self Organized Map (SOM) is a way to represent higher dimensional data in 2D (or 3D) such that similar data is grouped together. Nodes in 2D map are called neurons. Each neuron is assigned a weight vector of the same dimensionality as input space - you can read more here.
In ICM the initial placement can be either random, or generated by the following procedure. Find four mutually remote points in the input dataset and put in the corners and uniformly distribute the rest. The training is undertaken in the following way: a vector is chosen at random from the training set, then ICM finds the node with the closest distance to the chosen vector. Next the radius of the Best Matching Unit (BMU) neighborhood is calculated and then the weights of the BMU neighborhood nodes are adjusted - this is repeated for N iterations. The final mapping stage assigns input vectors to their closest nodes.
To run the Self Organizing Map method in ICM do the following:
- Read a sdf file into ICM.
- Chemistry/Visualize Chemical Space/ Self Organized Map
- Enter the name of the chemical table.
- You can choose to color the nodes by a particular column value and adjust the coloring by the Aggregate method (e.g. all members of the cluster will be colored by average, min or max).
- You can choose to select one or more columns of data to use as Descriptors.
- The map dimensions can be changed from 'auto' by adding an integer e.g. 4 will make a map size of 4x4
- If you do not check randomize - the method will use the four mutually remote points in the input dataset and all other initial points will be generated so they spread uniformly between these four.
- Connectivity edges option is for visualization purposes only to show 'close' clusters.
A map containing the nodes be displayed as shown below. Each node contains a stacked cluster of input compounds. Sequential clicking on the node loops through the representatives.