| Prev | ICM User's Guide 21.3 FAQ Graphics and Display | Next |
[ Font Size | Background color | Transparent ribbon | Faq color carbon | Faq molecule c | Faq remove select | Faq deselect | as_graph | Faq origin | Faq clipping plane | Faq interactions | Faq backbone | icmPocketFinder | Truncating Mesh | Color surface | Faq atom display | Dihedral Angle | Stereo | H-Bond Meshes | Movie | Color faq | Plane faq | Store current view faq | Ribbon faq | Local PDB | Local PDB | ODA | Faqmaps | Faqcontour | H-Bond Cutoff | iSee file | Blend Transition | Object Status | Faq autosave | Chain Breaks | ActiveICM File Path | Beep ]
Questions and answers relating to displaying molecules in the graphical user interface.
- How to change font size in html-documents, alignments, terminal, table, graphics?
- How to change the background color with one click?
- How to make a transparent ribbon?
- How do I specify a particular color for only the carbon atoms of a molecules?
- I have multiple proteins overlayed and I would like to color the carbon atoms of each molecule uniquely - how can I do this?
- If I have multiple graphical selections how can I remove one without losing the others?
- Can you suggest some ways to remove a graphical selection completely?
- What does as_graph mean?
- I have the XYZ origin cross displayed - How can I undisplay this?
- The front and back part of my structure have been clipped away how do I restore these regions in my display.
- Is it possible to draw dashed lines between atoms without displaying the corresponding bond length. I would like to do this to show which atoms are making key intermolecular interactions?
- How can I select only the backbone atoms?
- How can I find out which residues are surrounding a ligand binding pocket?
- How to truncate a mesh object?
- How can I change the color of a grob atom based surface according to the underlying atom coloring scheme?
- How can I display more information regarding an atom such as mmff type and charge?
- How can I display the dihedral angle?
- Which stereo glasses?
- I have made a H-Bond displayed in ICM-Browser-Pro which I would like someone to see in ICM-Browser - how do I do this?
- I would like to create a movie wherein I "walk" through the molecule by moving the front clipping plane to the end. Can I write a loop that moves the clipping and generates an image after every step to generate my movie afterwards?
- How do I color a structure by secondary structure?
- How can I display a structure in many different representations simultaneously?
- How can I store a view and return to it later?
- Some structures are displayed as noodles (the "worm" representation). Why are they displayed improperly?
- I would like to have a local copy of the PDB - any advice?
- I would like to have a local copy of the NCBI Blast database- any advice?
- How do I color ribbon models according to Optimal Docking Area (ODA)
- How do I load an electron density map into ICM?
- How can I contour an electron density map and adjust contour levels and color?
- I want to visualize weak hydrogen bonds how can I change the H-bond cutoff parameter
- What is an iSee File?
- How do I set a blend transition effect in a slide?
- How to check on the display status of an object in the command line.
- How to check on the display status of an object in the command line.
- ICM and Autosaving
- How to remove the dotted lines in chain breaks?
- When using ActiveICM is there a way to set a RELATIVE path to an icb file rath than ABSOLUTE?
- How do I turn off the annoying beep?
21.3.1 How to change font size in html-documents, alignments, terminal, table, graphics? |
First, click on this window of interest. Then just press Ctrl-+ (Ctrl-plus) to increase the font size and Ctrl-- (Ctrl-minus) to descrease the font size.
Here is a more complete list of methods to change the font size:
| location | how to change |
|---|---|
| tables | Ctrl +/- |
| alignment | Ctrl +/- |
| terminal | Ctrl +/- |
| html-documents | Button + and - |
| residue, atom and variable labels | change icm.clr file in $ICMHOME |
| graphics: 2D labels | right-click on a label and modify the font size/color |
| graphics: 3D labels | right-click at the lower left corner of a 3D label and modify the font size/color |
| graphics: distances and hbonds | right-click on a line modify the font size/color |
The sizes will also be preserved between sessions.
21.3.2 How to change the background color with one click? |
To change the background color with one mouse click, go to the Display toolbar and right click on the color you like. Warning: the left click on the same palette will color all the object, but will preserve the background color. The ICM command for changing the background is
color background red # or any other color
21.3.3 How to make a transparent ribbon? |
To make a transparent ribbon follow these steps:
- display only the ribbon of interest, undisplay all other objects and molecular representations
- color the ribbon as you like, and change its thickness by pressing on little "plus" and "minus" icons in the Display toolbar
- go to the Mesh toolbar
- select "from display" and click the mesh button
- undisplay the original ribbon (the mesh-ribbon will stay)
- right click on the newly created ribbon-mesh either in the workpanel or in the graphics
- select the type of representation from the popup menu for this mesh object (e.g. transparent, wire, etc.)
21.3.4 How do I specify a particular color for only the carbon atoms of a molecules? |
In this example we will display PDB 1CRN with yellow carbon atoms
- Select the pdb search Tab and enter 1crn and press enter.
- Double click on 1CRN in the ICM Workspace to select the molecule.
- Select the Wire representation button in the display panel.
- Select the Filter Graphical Selection button and select the Atom tab as shown below.
- Select only carbon atoms.
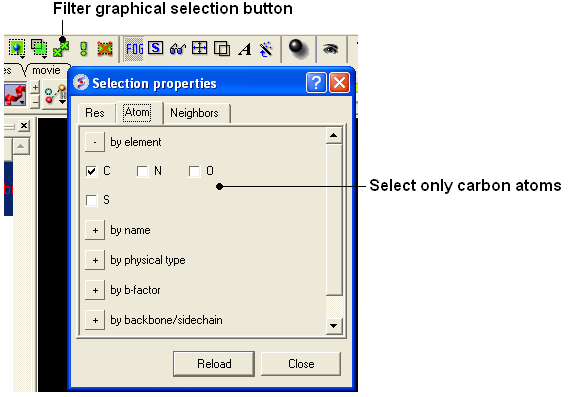
- Click and hold on the wire button in the display panel.
- Select the color.
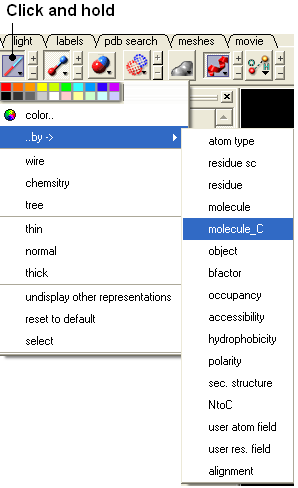
21.3.5 I have multiple proteins overlayed and I would like to color the carbon atoms of each molecule uniquely - how can I do this? |
{Color -C}
- Click and hold on the representation button (eg wire, ribbon, xstick etc..) and select Color ..by-> molecule_C.
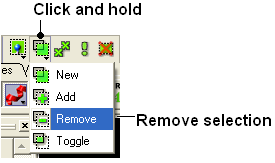
21.3.6 If I have multiple graphical selections how can I remove one without losing the others? |
One way to do this is to use the Remove selection button shown below and then drag over the region you would like to remove using the right-click mouse button.
21.3.7 Can you suggest some ways to remove a selection completely? |
- Use the Clear graphical selection button shown below.
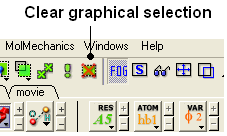
Some other ways include:
- Right click and drag in empty space in the graphical display.
- Double click in white space in the ICM Workspace.
21.3.8 What does as_graph mean? |
By default anything (object, molecule, residue, atom) is returned to a variable called as_graph. If you type as_graph in the terminal window you will see all the atoms, residues, molecules or objects contained in as_graph. You can also rename as_graph to a different variable name in order to save it for other functions. For example:
my_binding_pocket=as_graph

ds wire my_binding_pocket
To list the residues surrounding the pocket type:
String(as_graph)
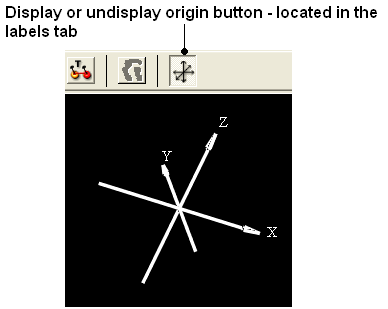
21.3.9 I have the XYZ origin cross displayed - How can I undisplay this? |
To undisplay the origin shown below:
- Select the labels tab and select the toggle origin button.
21.3.10 The front and back part of my structure have been clipped away how do I restore these regions in my display. |
It looks like the clipping tools have been used to clip away the front and back planes. Use the "unclip" button ( See the section entitled Clipping Tools).
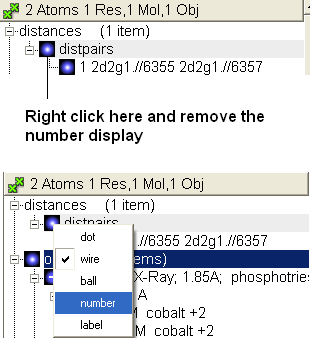
21.3.11 Is it possible to draw dashed lines between atoms without displaying the corresponding bond length. I would like to do this to show which atoms are |
making key intermolecular interactions?
To do this first you need to display the distance.
- Use the atom pick tool (See Selection Tools) to select the two atoms you wish to measure the distance between.
- Labels tab - measure distance (See Measuring distance between atoms section.
- When the distance label is displayed you will see a new section in the ICM Workspace entitled "distances-distpairs".
- Right click in the blue box next to the word distpairs as shown below.
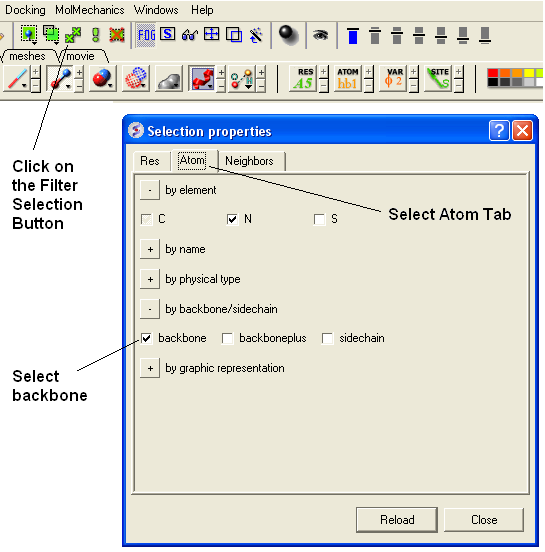
21.3.12 How can I select only the backbone atoms? |
- Select the Filter Selection Button (see below).
- Select the Atom Tab
- Select backbone.
21.3.13 How can I find out which residues are surrounding a ligand binding pocket? |
Use icmPocketFinder
- Tools/3D Predict/ icmPocketFinder
- Select the option to creat sequence sites.
- The residues surrounding the pocket will then be displayed in the table of pockets output that icmPocketFinder produces.
21.3.14 How to truncate a mesh object? |
Sometimes you have a mesh object (a.k.a. grob in ICM language) and you want to crop it. This can be achieved with the "make mesh from display"-tool (the "Mesh" toolbar) that creates a mesh object from the all visible objects in the Graphics window. The trick is to use the window border as a trimming device by moving the unwanted parts of the mesh outside the Display window. Follow these steps:
- Undisplay everything and display only the object(s) you need. They will form a single mesh-object at the end of your operation
- Use the right mouse click to rotate and the middle mouse button to translate the mesh object so that only the parts you want to retain are visible and the unwanted parts are outside the window
- Go to the Mesh toolbar and select "from display" tool
- Click on the mesh button and create a new truncated object with an even flat border
- rename it if needed
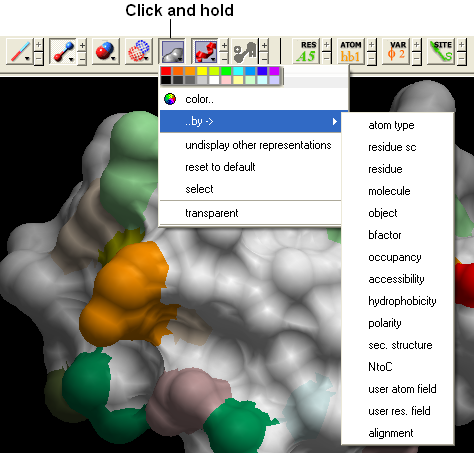
21.3.15 How can I change the color of a grob atom based surface according to the underlying atom coloring scheme? |
To do this:
- Clicking and hold down on the skin representation button in the Display tab and choose the "color by option". You can then color by atom type and a number of other parameters.
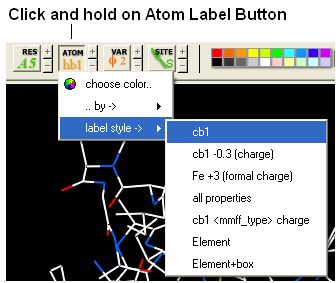
21.3.16 How can I display more information regarding an atom such as mmff type and charge? |
- Select an atom
- Select the Display tab
- Click and hold down on the label atom button
- Select Label Style
- Choose the mmff option or formal charge.
21.3.17 How can I display the dihedral angle? |
To label the dihedral angle the molecule needs to be converted into an ICM object.
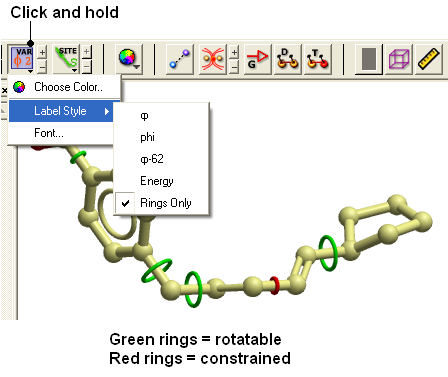
- Convert the molecle to an ICM object.
- Select the atoms for which you would like to display the dihedral angle (see display structure or selection toolbar).
- Click on the toggle variable label button shown above located in the display tab.
- Change the level of detail displayed by using the +/- buttons.
21.3.18 Which stereo glasses? |
Stereo Support for Any PC under NT/2000/XP (not available in ICM Browser).
As of version 2.7.060, we have introduced support for viewing of icm graphics in stereo on nearly any PC using Above-and-Below format and CrystalEyes for PC from StereoGraphics, which was previously only available on the SGI platform.
Hardware requirements:
CrystalEyes or CrystalEyes II eyewear + emitter, version for the PC (Important! workstation emitter will not work), available from QualixDirect (StereoGraphics doesn't seem to sell their products directly. Practically any graphics card would work, though higher resolutions and support for hardware OpenGL acceleration is desirable. However, your monitor has to be able to support high vertical refresh frequencies (120Hz or better).
Currently, stereo is only supported under Windows NT/2000/XP. Due to an apparent bug in Windows 95 implementaion of OpenGL, switching ICM to stereo mode may cause a program crash unless you have a graphics card which supports OpenGL stereo directly. We are working on a workaround to this problem.
You may always try to press Alt-S in your graphics window and see what happens. It should toggle the stereo mode. Unless you have built-in stereo, the main graphics window should get squeezed by half and a second window appears below. Close or minimize all other windows on your desktop to avoid confusing displays. At this point, you should press the button on your emitter to change the mode of the monitor. The two windows will stretch and overlap, producing a double picture. Try to view it with the glasses - you should see stereo! If the two pictures do not align vertically, you might need to adjust stereoWinOffset parameter in ICM.
PC's with built-in stereo support: A limited number of graphics cards provide built-in stereo modes. You would need a different emitter ( the workstation type ). Generally, ICM will try to utilize such built-in capabilities if they are accessible through OpenGL graphics driver. We know that hardware stereo in ICM works fine on the Integraph graphics workstations (see www.intergraph.com). A caveat: to switch to the hardware stereo mode on an Intergraph machine you need to reboot. Please report the results to us.
21.3.19 I have made a H-Bond displayed in ICM-Browser-Pro which I would like someone to see in ICM-Browser - how do I do this? |
ICM-Browser does not have energy functions and therefore H-Bonds are disabled. If you are using ICM-Pro or ICM-Browser-Pro and you know that someone with only browser will need to see theH-Bonds that you have displayed you need to make a mesh of the H-bonds. To do this:
- display h-bonds
- click on the meshes tab
- click on the first drop down arrow and select from display
- click on the build surface for an object button (grey blob button) next to drop down menu
- a graphical object should be built - may look a bit strange at first but you can change the view by right clicking on the mesh in the ICM workspace
- only whatever is currently being viewed in the display will be converted
The easiest way is to interpolate between front and back clipping plane
v1=View()  # define the 1st view   # v2=View()  # cut through clipping plane

for i=1,100   set view View(v1,v2,i*0.01) # interpolation

write image String(i) png

endfor
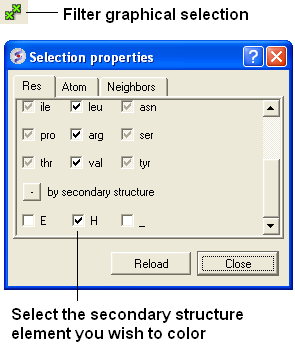
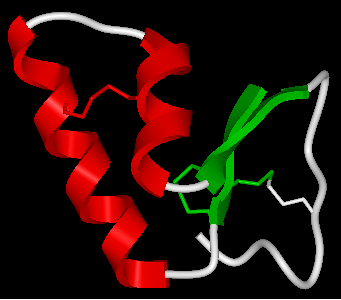
21.3.21 How do I color a structure by secondary structure? |
You may wish to color your structure accordingly:
Helix: Red Beta Sheet: Green Loops: White
To do this you should use the filter graphical selection button and then select either H, E or _ for helix, sheet or loop. Then click on the color panel in the display tab.
21.3.22 How can I display a structure in many different representations simultaneously? |
Use the slide button and make a series of slides.
21.3.23 How can I store a view and return to it later? |
To store multiple views of an object and quickly change between each one use the "eye" button shown below.
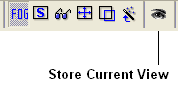
For more information see the section entitled Store Current View
21.3.24 Some structures are displayed as noodles (the "worm" representation). Why are they displayed improperly? |
Question : Some structures are displayed as noodles (the "worm" representation). Why are they displayed improperly?
Answer: There are several possible reasons:
- The ribbon display preferences are incorrect
- PDB entry lacks the secondary structure description
- PDB entry is incomplete (e.g. Ca- only, or an ICM mini-xpdb object); therefore, the secondary structure cannot be assigned
- Perform the following steps to fix your display preferences: Go to File.Preferences and click on the Ribbon tab. Then uncheck the Ribbon worm checkbox. Alternatively left-click on the ribbon icon in the Display dialog and select Ribbon .
- If the above manipulations do not fix the problem, the problem could be attributed to the PDB entry's lack of the secondary structure information. The secondary structure can be assigned with the Tools.Assign Helices and Strands menu.
- It is possible that you are looking at an ICM mini-xpdb entry or a PDB entry with incomplete information about atom coordinates (could be a Calpha only entry). In this case the secondary structure could not be assigned.
21.3.25 I would like to have a local copy of the PDB - any advice? |
Accessing PDB files locally
The simplest way to access pdb files locally, is to download the compressed pdb files in the old pdb format (not the mmcif files!) from the PDB ftp site and reset the values in File/Preferences/Directories .
By default ICM will set the s_pdbDir and pdbDirStyle variables to download each file from the PDB web site. In this case to update the PDB table of entry headers and the blast files with PDB sequences, select Edit/PDBSearch and click on the "Update PDB Table" button for the headers and the "Update PDB Sequences button for the sequences.
21.3.26 I would like to have a local copy of the NCBI Blast database- any advice? |
Accessing the NCBI sequence databases locally
To enable ICM sequence search simply dowload NCBI blast database files to the local s_blastdbDir directory (see File/Preferences/Directories ). Download only three file types for the databases of interest: *.pin, *.phr, *.psq , e.g. nr.pin,nr.phr,nr.psq to your s_blastdbDirectory ( File/Preferences/Directories ) or anywhere else. You can download Blast formatted databases from here ftp://ftp.ncbi.nih.gov/blast/db/ eg. pdbaa - PDB sequence database.
ICM command find database and the Bioinfo/Find_and_Align macro can then use the blast files for both fast searches and ZEGA searches.
21.3.27 How do I color ribbon models according to Optimal Docking Area (ODA) |
The Optimal Docking Area (ODA) tool is used to predict protein-protein interaction sites.
Tools/3Dpredict/ODA/3D-Mesh-Envelope
21.3.28 How do I load an electron density map into ICM? |
You can load CCP4 maps into ICM
- File/Open
- File type = ICM maps
21.3.29 How can I contour an electron density map and adjust contour levels and color? |
Load the electron density map into ICM and then follow the instructions in the section entitled Contour Electron Density Map.
21.3.30 I want to visualize weak hydrogen bonds how can I change the H-bond cutoff parameter? |
GRAPHICS.hbondMinStrength parameter determines the hbond strength threshold for hbond display. The strength value is between 0. and 2. By changing 1. to 0.2 you will see more weak hydrogen bonds.
- In the command line type
GRAPHICS.hbondMinStrength = 0.2
21.3.31 What is an iSee File? |
A common question is - what is an iSee file? An iSee file is a term coined by scientists at the Structural Genomics Consortium at Oxford University for ICM molecular documents saved in .icb format.
>From the SGC website:
"Different from PDF files and paper manuscripts, iSee files allow total interactivity with the scene/ image by the user. Also, real-time rendered movies enable smooth transition of a viewpoint to another, helping to convey the sense of depth and inter-relationship of different structural features in space. iSee files also permit non- linear navigation through the expert annotation, thus not restraining the user to the sequencial explanation of traditional molecular movies."
See: http://www.sgc.ox.ac.uk/iSee/ http://www.molsoft.com/sgc.html
How to make an iSee file? http://www.molsoft.com/gui/tut6.html
21.3.32 How do I set a blend transition effect between two slides? |
In ICM version 3.5-1l a new blending transition effect between slides is available. To see this in action download the latest version of ICM or the free ICM-Browser and view this icb file:
http://www.molsoft.com/~andy/blend.icb
To generate this transition effect:
-
1. Make a couple of slides - click camera button at bottom of the gui
- Note: to see the blending transition the transition needs to be made
between different representations e.g. wire to ribbon
2. Right click on the name of the slide in the ICM workspace and
select edit slide
3. At the bottom of this window you will see options for the currently
available transitions - blend and smooth - check which one you would
like to use and the transition time in ms.
21.3.33 How to check on the display status of an object in the command line. |
You can check if molecule is displayed by using 'DD' selector.
For example:
Mol(a_1xbb.a//DD) == a_1xbb.a # returns 'yes' if at least one atom in the molecule is displayed

Res(a_1xbb.a//DD) == Res(a_1xbb.a) # returns 'yes' if at least one atom in each residue is displayed

Atom(a_1xbb.a//DD) == Atom(a_1xbb.a) # returns 'yes' if every single atom is displayed
21.3.34 ICM and AutoSave |
There are two preferences controlling 'autosave/restore behaviour'
GUI.autoSave  # toggles autosave on/off
GUI.autoSaveInterval  # autosave interval in min.
| NOTE: that ICM will not perform autosave when idle. autosave is only preformed if autoSaveInterval was expired AND some command was executed. |
If ICM crashes it renames the last autosaved file to 'icmcrash' prefix. On startup ICM checkes if s_tempDir directory contains at least one file with prefix = 'icmcrash' and offers to restore session from it. 'icmautoXXXX' and 'icmcrashXXXX' are normal icm files and can be copied/renamed and read directly with 'read binary' or through GUI.
ICM deletes 'icmautoXXXX' file before normal exit. Note that in certain cases these files will be kept. E.g: if you press "Ctrl+C" on linux will not receive crash signal -> 'icmauto' will not be renamed to the 'icmcrash' and will be kept.
| NOTE: autoSavePeriod is used to periodically store stack in montecarlo simulations. It has nothing to do with save/restore functionality |
21.3.35 How to remove the dotted lines in chain breaks. |
See the how to section entitled "How to remove chainbreaks (dotted lines)".
In version 3.6-1a and above you can use the options in the display tab. Click an d hold on the ribbon button. You can then select Display Chain Breaks/ None.
21.3.36 When using ActiveICM is there a way to set a RELATIVE path to an icb file rath than ABSOLUTE? |
When you open ppt with embedded activeICM it actually tries original absolute location and then (if not found) looks for that file in the current directory.
Unfortunately the meaning of "current directory" is not well defined in Power Point. For example if you double click on ppt file it sets the current directory to the folder which conatains that ppt file, but if you open the same file from the PowerPoint it does not set current directory accordingly.
So, let's say you have aaa.ppt which has c:\some\location\aaa.icb embedded. Nowyou want to copy that presentation to your laptop. You need to put these two files in the same directory. After that on you laptop you can just double click on aaa.ppt. Note, if you open aaa.ppt from "File-Open" it'll popup open file dialog where you should locate aaa.icb.
21.3.37 How do I turn off the annoying beep? |
To turn off the beep noise when an error is made in the command line type:
l_beep = no
write system preferences # if you want to store this permanently
You can also remove it in the system preferences tab in File/Preferences
| Prev Faq quad buffer | Home Up | Next FAQ-Structure |