| Prev | 2.18 Tables (structures) | Next |
[ CONSENSUS | CONSENSUSCOLOR | FILTER | FTP | _GRAPHICS | GRID | GROB | GUI | IMAGE | LIBRARY | OBJECT | PLOT | _SITE | WEBLINK | WEBAUTOLINK ]
The following predefined icm-shell tables are collections of different icm-shell-objects related to a certain topic. Note that these tables (as opposed to user-defined ICM tables ) usually only have the header section. You can show and list them. You can also change any table element by the usual icm assignment:Examples:
 IMAGE.color = yes       # this member is a logical
 IMAGE.stereoBase = 2.5  # redefine real distance between stereo panels
2.18.1 CONSENSUS | [Top] |
#>T CONSENSUS
#>-symbol------fraction----residues---
   A           85          A
   C           85          C
   Q           85          Q
...
   d           60          ND
   -n          70          ED
   +o          60          RK
   gj          60          G
   q           70          Q
   p           60          P
   t           60          TSN
   "#h"        85          WLVIMAFCYHP
   %f          65          WLVIMAFCYHP
   " g"        85          -
See also: CONSENSUSCOLOR , CONSENSUS_strength , color rs_ alignment.
2.18.2 CONSENSUSCOLOR | [Top] |
#>T CONSENSUSCOLOR
#>-residue-----color-------symbols----
   *           *           *         # separator between sections
   ED          "#ff0000"   "-EDp"    # E and D residues will be colored red under '-','E' or 'D'
   KR          "#0000ff"   "+KRp"
2.18.3 FILTER | [Top] |
[ FILTER.Z | FILTER.gz | FILTER.uue ]
contains filters which can be applied to the input stream in the read command. Components have names corresponding to standard file name extensions; their string value is a unix filter. Token %s is a placeholder for the file name. The provided defaults can be redefined in your _startup file. You can also add your own extensions and filters by doing the following:z = "pcat %s" # define the action for the unix packed files group table append FILTER header z # append new filter to the structureThe mechanism ICM employs allows to keep the transformed files intact and avoid creating temporary files when possible (e.g. uuencode unix command always creates an output file). Existing extensions and defaults are given below. You may need to redefine the defaults by adding the exact path to the utility or using alternatives.
!_ FILTER.Z allows you to read the compressed files (*.Z) directly leaving the compressed file intact. The default value: "zcat %s" . If you do not have zcat utility, try
FILTER.Z = "uncompress -c %s"
!_ FILTER.gz The default value is "gunzip -c %s" .
!_ FILTER.uue The default value is
"sed 's:begin .*:begin 600 /tmp/UUPtm:' %s | uudecode && cat /tmp/UUPtm && rm -f /tmp/UUPtm"This works for UNIX file system, write your own on the PC, if needed.
2.18.4 FTP | [Top] |
[ FTP.createFile | FTP.keepFile | FTP.proxy ]
table which controls reading from ftp.!_ FTP.createFile (default no ). This flag is not active yet. The file is always created in the s_tempDir directory.
!_ FTP.keepFile (default no ). If yes, the temporary file is kept in the s_tempDir directory. Otherwise the file is deleted.
!_ FTP.proxy string path to the proxy server for connections through firewall. Default: "" (empty string).
2.18.5 GRAPHICS | [Top] |
[ GRAPHICS.ballRadius | GRAPHICS.ballStickRatio | GRAPHICS.clashWidth | GRAPHICS.displayLineLabels | GRAPHICS.displayMapBox | GRAPHICS.dnaBallRadius | GRAPHICS.dnaRibbonRatio | GRAPHICS.dnaRibbonWidth | GRAPHICS.dnaRibbonWorm | GRAPHICS.dnaStickRadius | GRAPHICS.grobLineWidth | GRAPHICS.hbondStyle | GRAPHICS.hbondWidth | GRAPHICS.hetatmZoom | GRAPHICS.hydrogenDisplay | GRAPHICS.light | GRAPHICS.mapLineWidth | GRAPHICS.quality | GRAPHICS.rainbowBarStyle | GRAPHICS.resLabelDrag | GRAPHICS.ribbonRatio | GRAPHICS.ribbonWidth | GRAPHICS.ribbonWorm | GRAPHICS.selectionLevel | GRAPHICS.selectionStyle | GRAPHICS.stereoMode | GRAPHICS.stickRadius | GRAPHICS.wormRadius ]
display parameters for different graphics representations.!_ GRAPHICS.ballRadius
radius (in Angstroms) of a small ball displayed as a part of ball or xstick graphical representations of a molecule.
Default (0.15)
!_ GRAPHICS.ballStickRatio
A default ratio of ball and stick radii. This ratio is applied when the styles are switched from the GUI xstick toolbar.
Default (1.4)
!_ GRAPHICS.clashWidth
relative width of a displayed clash . This parameter can be changed from the File/Preferences/DisplayGeneral menu.
See also: lineWidth , GRAPHICS.grobLineWidth , GRAPHICS.hbondWidth , GRAPHICS.mapLineWidth , GRAPHICS.wireWidth.
Default (1.)
!_ GRAPHICS.displayLineLabels
enables/disables the display of edge lengths (inter-point distances) of a grob generated with the Grob "distance" .. ) function. This parameter can be changed from the File/Preferences/DisplayGeneral menu.
See also: Grob("distance" .. )
Default (yes)
!_ GRAPHICS.displayMapBox
controls if the bounding box of a map is displayed (see display map ).
Default (yes)
!_ GRAPHICS.dnaBallRadius DNA bases in ribbon representation are shown as balls controlled by the above real parameter. You can undisplay them with the: undisplay ribbon base command.
Default: 1.5
!_ GRAPHICS.dnaRibbonRatio real ratio of depth to width for the DNA ribbon .
Default: 0.3
!_ GRAPHICS.dnaRibbonWidth real width (in Angstroms) of the DNA ribbon .
Default: 2.
!_ GRAPHICS.dnaRibbonWorm logical which, if yes, makes the DNA backbone ribbon round, rather than rectangular.
Default: no
!_ GRAPHICS.dnaStickRadius real radius of the sticks representing bases in DNA ribbon .
Default: 0.72
!_ GRAPHICS.grobLineWidth
relative width of displayed lines of 3D meshes ( grobs ). Also affects the interatomic distance display. This parameter can be changed from the File/Preferences/DisplayGeneral menu.
See also: lineWidth , GRAPHICS.clashWidth , GRAPHICS.hbondWidth , GRAPHICS.mapLineWidth .
Default (1.)
!_ GRAPHICS.hbondStyle
determines the style in which hydrogen bonds are displayed. Here hbond-Donor, Hydrogen, and hbond-Acceptor atoms will be referred to as D, H and A, respectively,
 GRAPHICS.hbondStyle = "dash"
        1 = "dash"      # the default choice. Just a line
        2 = "length"    # show the D-A distance in addition
        3 = "length and angle"  # show both the distance and the 180. - <D-H.. A> angle
The best possible value for a non-linearity angle is 0. .
The display dialog has a small button to roll through this preference.
See also: GRAPHICS.hbondWidth .
!_ GRAPHICS.hbondWidth
relative width of a displayed hbond . This parameter can be changed from the File/Preferences/DisplayGeneral menu.
See also: lineWidth , hbond display hbond, GRAPHICS.grobLineWidth , GRAPHICS.clashWidth , GRAPHICS.mapLineWidth .
Default (1.)
!_ GRAPHICS.hetatmZoom
The default ball and stick radii of a ligand can be different by the GRAPHICS.hetatmZoom factor. This makes a better ligand view since the ligand stands out from the surrounding protein atoms.
See also, icm.clr file about changing the default color for carbon atoms in ligands (a.k.a. hetatm ) ( atom H color ) Default (1.5)
!_ GRAPHICS.hydrogenDisplay
determines the default hydrogen display mode for the display command.
 GRAPHICS.hydrogenDisplay = "polar"
        1 = "all"   # all hydrogens are shown
        2 = "polar" <-- current choice  # polar displayed, the non-polar hidden
        3 = "none"  # no hydrogens are displayed
!_ GRAPHICS.light
a rarray of 13 elements between 0. and 1. which controls the main properties of lighting model in GL. The sections of this array can be changed with four sliders of the Display tab in a top tool bar. The following elements are defined:
| Elements Property Range Default Comment |
|---|
| GRAPHICS.light[1] shininess 0.,1. 1. property of the solid material |
| GRAPHICS.light[2:4] ambient light 0.,1. {0.15 0.15 0.15} intensity of RGB for ambient light |
| GRAPHICS.light[5:7] diffuse light 0.,1. {0.6 0.6 0.6} intensity of RGB for diffuse light |
| GRAPHICS.light[8:10] specular light 0.,1. {0.35 0.35 0.35} intensity of RGB for specular light |
| GRAPHICS.light[11:13] emission 0.,1. {0. 0. 0.} intensity of RGB for emitted light |
To re-render the solid graphics with new parameters, use the
display new reflectioncommand.
Example:
build string "se his trp glu"
display cpk
color background blue
GRAPHICS.light[5:7] = {0.2 0.2 0.6}
display new reflection
!_ GRAPHICS.mapLineWidth
relative width of lines and dots of a displayed map . This parameter can be changed from the File/Preferences/DisplayGeneral menu.
See also: lineWidth , GRAPHICS.grobLineWidth , map , GRAPHICS.hbondWidth .
Default (1.)
!_ GRAPHICS.quality integer parameter controlling quality (density of graphical elements) of such representations as cpk, ball, stick, ribbon . Do not make it larger than about 20 or smaller than 1. This parameter supersedes the previous ballQuality parameter.
We recomment to make this parameter at least 15 if you want to make a high quality image. You can also increase the number of image resolution by making the image window 2,3,4 times larger (in the example below it is 2 times larger) than the displayed window.
GRAPHICS.quality = 15
display ribbon

# press Ctrl-D  for the fog effect, move clipping planes, change fogStart

write image png window=2*View(window)
Default: 5.
!_ GRAPHICS.rainbowBarStyle determines if and where the color bar will appear after a molecule is colored by an array. Coloring by an array is one of the options of the display and color commands.
- = "left" <- default choice
- = "right"
- = "no text"
- = "no bar"
!_ GRAPHICS.resLabelDrag if yes, enables dragging of the displayed residue labels with the middle mouse button. The labels can be reset to their initial positions with the set residue label distance rs_
command. The intial position is defined by the relative displacements of {0. 0. 0.} from the special "residue label-carrying" atom of the residue, see the set label as_ command. See also resLabelStyle
Default ( no ).
!_ GRAPHICS.ribbonRatio real ratio of depth to width for the protein ribbon .
Default: 0.3
!_ GRAPHICS.ribbonWidth real width of the protein ribbon .
Default: 1.
!_ GRAPHICS.ribbonWorm logical parameter, if yes, makes the ribbon round, rather than rectangular.
Default: no
!_ GRAPHICS.selectionLevel
preference for the selection level of as_graph selection. The atoms, residues, molecules or objects selected interactively in the graphics window are automatically stored in the as_graph variable. The preference may have the following values.
  GRAPHICS.selectionLevel = "atom"
        1 = "object"
        2 = "molecule"
        3 = "residue"
        4 = "atom" # default
        5 = "variable"
The GRAPHICS.selectionLevel can be switched either interactively, e.g.
GRAPHICS.selectionLevel = 3or from GUI by selecting the level combo box with the following choices: O (object), M (molecule), R (residue), x (atom), or an icon of a torsion (variable).
!_ GRAPHICS.selectionStyle
preference for the style in which the graphical selection is shown. The preference may have the following values.
  GRAPHICS.selectionStyle = "color"
        1 = "none"
        2 = "cross" # the default choice
        3 = "color"
        4 = "both"
In the 1-st mode ( "none") only a single selection mark is shown. It is convenient when
you do not want multiple selection marks to overwhelm the image.
The 3-rd mode is incovenient if you want to try different colored displays for the selected fragments.
!_ GRAPHICS.stereoMode
- "up-and-down"
- "line interleaved" <-- current choice
- "in-a-window"
The "line interleaved" mode can be used with a new type of frame splitter at the line level. In this case the odd lines from one stereo-image are interleaved with the even lines of another. The side-effect of this mode is that the intensity is reduced in half since at each moment one sees only one half of the lines. The splitter device for this mode can be purchased from Virex (www.virex.com). This mode produces a dark stereo image but is easily available (requires stereo goggles, e.g. from Virex).
The "in-a-window" mode is used in SGI workstations and in a Linux workstation with an advanced graphics card supporting a quad graphics buffer. In this mode the hardware stereo regime applies only to an OpenGl window. This is the best mode but it requires an expensive graphics card (plus the stereo goggles).
Note: LCD screens can not display a stereo image since the image is not continuously updated at high frequency. This technical problem may be solved in the future (so we hear).
!_ GRAPHICS.stickRadius
radius (in Angstroms) of a cylinder displayed as a part of stick or xstick graphical representation of a molecule.
Individual (residue-wide) control of stick radii.
In order to modify the default values of the radii from the command line set the 3rd field of the residue of interest to the new value. For example:
set field as_Residue_Selection number=3 r_newStickRadiusIn this case the ball radius will be changed according to the radio of the default parameters (e.g. GRAPHICS.ballRaduis/GRAPHICS.stickRadius )
Default (0.4).
!_ GRAPHICS.wormRadius
radius of coiled segments (i.e. those where the secondary structure is marked as "_") of a polypeptide chain in ribbon representation.
Default (0.3).
2.18.6 GRID | [Top] |
[ GRID.gcghExteriorPenalty | GRID.margin | GRID.maxEl | GRID.minEl | GRID.maxVw ]
parameters for the grid energy calculations (see also "gh,gc,ge,gs,sf" energy terms).!_ GRID.gcghExteriorPenalty
A preference to allow automatically impose a repulsive penalty outside the area covered by the van der Waals maps ( m_gc and m_gh ).
- = "repulsive" <- the default
- = "zero"
!_ GRID.margin
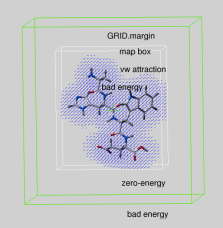
|
real parameter determining the extra penalty-free space around the map bounding box if GRID.gcghExteriorPenalty = "repulsive" (see above). For any atom which gets outside the map-bounding box expanded by GRID.margin, its grid van der Waals energy ( "gc" or "gh" ) is penalized by the GRID.maxVw value. This is the same penalty value which atoms get if they severely clash with other atoms. |
Therefore, if you set up grid energy calculations it is essential either to create a big enough box or set a sufficient margin to allow ligand rearrangements near the receptor surface. If GRID.margin is very large, your ligand will be "on the loose" and may spend too much time flying in open air. It is recommended that the margin is not larger than the diameter of your ligand.
Default: 0.00 A
!_ GRID.maxEl real truncation parameter. Default: 20.0 kcal/mole.
!_ GRID.minEl Default: -20.0 kcal/mole.
!_ GRID.maxVw
The truncation level of the van der Waals repulsion energy precalculated in the "gc" grid energy term. This number also is used as a penalty for the atoms outside the map box expanded by GRID.margin .
Default: 3.0 kcal/mole.
2.18.7 GROB | [Top] |
[ GROB.atomSphereRadius | GROB.relArrowSize | GROB.arrowRadius | GROB.relArrowHead ]
Parameters related to graphics objects. See also the Grob family of functions.!_ GROB.atomSphereRadius
default radius (in Angstroms) which is used to select a patch on the surface of a grob. Used in the color grob as_selection color command. See also: Grob( g R_6) function to return a patch of certain color.
Default: 4.0.
!_ GROB.relArrowSize a real relative arrow size ([0.,1.]). Default: 0.2.
!_ GROB.arrowRadius a real arrow radius in Angstoms used by the Grob "ARROW", R_ ) function. Default: 0.5.
!_ GROB.relArrowHead a real ratio of the arrow head radius to the arrow radius. This parameter is used by the Grob "ARROW", R_ ) function. Default: 3.0.
2.18.8 GUI | [Top] |
!_ GUI.workspaceTabStyle
allows to change the style of ICM-object tabs created in the workspace panel of ICM GUI.
- = "icon title" # default
- = "icon"
- = "title"
2.18.9 IMAGE | [Top] |
[ IMAGE.quality | IMAGE.printerDPI | IMAGE.lineWidth | IMAGE.scale | IMAGE.stereoBase | IMAGE.stereoAngle | IMAGE.gammaCorrection | IMAGE.color | IMAGE.compress | IMAGE.generateAlpha | IMAGE.stereoText | IMAGE.previewer | IMAGE.previewResolution | IMAGE.orientation | IMAGE.paperSize | IMAGE.rgb2bw | IMAGE.writeScale ]
table contains settings used by the following commands creating image files:!_ IMAGE.quality this integer parameter allows to improve quality of vectorized postscript images saved by the write postscript command. Actually this parameter only changes one number in the header of a postscript file. You can also manually edit the file to correct this number. This number defines the number of divisions of larger triangles into smaller ones accompanied by interpolation of colors which occurs during printer interpretation of the postscript stream to provide smooth continuous transitions. The optimal value of this parameter depends on the maximal triangle size. It may grow as large as 100 for a single triangle on a page. Typically for a molecular image with molecular surface IMAGE.quality=3 is sufficient.
Important. Do not set the parameter to values higher than 5 for the molecular image, your printer will die!
Default: 3
!_ IMAGE.printerDPI this integer parameter the printer resolution in Dot Per Inch (DPI). Important for the write image postscript command.
Default: 300
!_ IMAGE.lineWidth this real parameter specifies the default line width for the postscript lines.
Default: 1.0
!_ IMAGE.scale real variable. If non zero, controls the image scale with respect to the screen image size. The screen image resolution (or Dots-Per-Inch) is usually 72. Let's assume printer DPI to be 300 (see the IMAGE.printerDPI parameter). In this case IMAGE.scale=1. will make the printed image the same pixel size (which is about 4 times smaller) than the screen image. For pixel images saved by write image postscript command integer IMAGE.scale values ( 2., 3., 4. ) are preferable. That is what auto mode (IMAGE.scale=0.0) is trying to do. This consideration is NOT important for the vectorized postscript images created by the write postscript command.
Default: 0.0 (i.e. auto mode: maximum size fitting the page in given IMAGE.orientation)
!_ IMAGE.stereoBase real variable to define the stereo base (separation between two stereo panels) in the write image postscript and write postscript command.
Default: 2.35 inches, (~ 60mm)
!_ IMAGE.stereoAngle real variable to define stereo angle (relative rotation of two stereo images) in the write image postscript and write postscript command.
Default: 6.0 degrees.
!_ IMAGE.gammaCorrection real variable to to lighten or darken the image by changing the gamma parameter. A gamma value that is greater than 1.0 will lighten the printed picture, while a gamma value that is less that 1.0 will darken it. You may adjust your gamma correction parameter for your printer with respect to your display and add this setting to the _startup
Default: 2.0
!_ IMAGE.color logical to save color or black_and_white ('bw') images. You can override this parameter by using the explicit bw option in the write image command.
Default: yes
!_ IMAGE.compress logical to toggle simple lossless compression, standard for .tif files. This compression is required to be implemented in all TIFF-reading programs.
Default: yes
!_ IMAGE.generateAlpha logical to toggle generation of the alpha (opacity) channel for the SGI rgb, tif and png image files to make the pixels of the background color transparent.
Be careful. The alpha channel is set to 1. for every pixel in your image which has the same color as the background. Therefore there is a danger that the same color will be accidently used inside your image. If you nevertheless want to generate the alpha-channel, use a rare color your background (not black, but rather green, e.g. rgb = {0.,0.976,0.} .
Default: yes
!_ IMAGE.stereoText logical to make text labels for only one panel or both panels of the stereo diagram.
Default: yes
!_ IMAGE.previewer a string parameter to specify the external filter which creates a rough binary (pixmap) postscript preview and adds it to the header of the ICM-generated high resolution bitmap or vectorized postscript files saved by the write image postscript, and write postscript , respectively . This preview information is compliant with EPSI (encapsulated Postscript interchange file format) and is useful to see a draft image instead of a empty rectangle upon inclusion of the postscript file into other drawing and imaging software like IRIS showcase.
Default: "gs -sDEVICE=pgmraw -q -dNOPAUSE -sOutputFile=- -r%d –– %s"
!_ IMAGE.previewResolution integer resolution of the rough bitmap preview added to the vectorized postscript file in lines per inch. Recommendations:
- 10 - very rough ( 1/10th of an inch )
- 20 - a reasonable preview but no fine details
- 30 - a fine preview, do not increase it any higher since the file will become too large.
!_ IMAGE.orientation preference to specify image orientation.
- = "portrait" <- default
- = "landscape"
- = "auto"
Default: "portrait"
!_ IMAGE.paperSize preference to specify paper size.
- = "Letter (8.5x11")" <- default
- = "Legal (8.5x14")"
- = "11x17""
- = "A4 (210x297mm)"
- = "A3 (297x420mm)"
Default: "Letter (8.5x11")"
!_ IMAGE.rgb2bw rarray of 6 elements defining translation of rgb colors into black and white ('bw') grades. The array is {RED_scale, GREEN_scale, BLUE_scale, RED_bias, GREEN_bias, BLUE_bias} and the default values are {0.3125, 0.5, 0.1875, 0., 0., 0.}.
!_ IMAGE.writeScale
an integer parameter used to increase the image resolution in the Quick Image Write tool (see a little camera on the top toolbar). This tool uses the
write image png window= N * View(window)command where N defines if the image is N-times bigger than the screen image. This parameter can be changed from File/Preferences/Image dialog.
2.18.10 LIBRARY | [Top] |
 LIBRARY.bbt="icm"  # bond bending types
 LIBRARY.bci="icm"  # mmff bond charge increments
 LIBRARY.bst="icm"  # bond stretching types
 LIBRARY.clr="icm"  # colors, gui controls
 LIBRARY.cmp="icm"  # amino-acid comparison matrix
 LIBRARY.cnt="icm"  # distant restraint types
 LIBRARY.cod="icm"  # atom codes
 LIBRARY.hbt="icm"  # hydrogen bonding types
 LIBRARY.hdt="icm"  # hydration types
 LIBRARY.lps="icm.lps"  # loop database, rebuilt with write model [append]
 LIBRARY.men="icm.gui"  # GUI commands
 LIBRARY.mmbbt= "mmff"  # mmff bond bending
 LIBRARY.mmbst= "mmff"  # mmff bond stretching
 LIBRARY.mmtot= "mmff"  # mmff torsions
 LIBRARY.mmvwt= "mmff"  # mmff van der Waals
 LIBRARY.rst="icm"  # variable restraint types
 LIBRARY.tor="icm"  # precomputed icmff torsion params
 LIBRARY.tot="icm"  # torsion types
 LIBRARY.vwt="icm"  # van der Waals types
 LIBRARY.res={"icm","usr"}
Example:
 LIBRARY.res=LIBRARY.res // "./benz.res" # just append
 LIBRARY.cod="./newCodes.cod"
 read library
2.18.11 OBJECT | [Top] |
 OBJECT.bfactor  =yes
 OBJECT.charge   =yes
 OBJECT.occupancy=yes
 OBJECT.site     =yes
 OBJECT.display  =no
 OBJECT.library  =no
 OBJECT.auto     =no
Example:
 OBJECT.auto = no
 OBJECT.display = yes
 read object "crn"
 display ribbon a_/1:40
 set plane 2
 display cpk a_/12
 write object "tm"  # graphics and planes are written
 delete a_*.
 read object "tm"
2.18.12 PLOT | [Top] |
[ PLOT.numberOffset | PLOT.fontSize | PLOT.lineWidth | PLOT.markSize | PLOT.Yratio | PLOT.logo | PLOT.color | PLOT.orientation | PLOT.seriesLabels | PLOT.font | PLOT.labelFont | PLOT.rainbowStyle | PLOT.box ]
Contains settings used by the plotcommand. All real sizes are expressed in the Postscript "points" equal to 1/72" ( about 1/3 mm ).!_ PLOT.numberOffset integer offset for the X-coordinate with the number option. This option is used in a number of macros generating multisection plots for amino-acid sequences.
Default (0).
!_ PLOT.fontSize real font size. Any reasonable number from 3. (1 mm, use a magnifying glass then) to 96.
Default (10.0).
!_ PLOT.lineWidth real line width for graphs (not the frame and tics)
Default (1.0).
!_ PLOT.markSize real mark size in points. Allowed mark types: line, cross, square, triangle, diamond, circle, star, dstar, bar, dot, SQUARE, TRIANGLE, DIAMOND, CIRCLE, STAR, DSTAR, BAR. Uppercase words indicate filled marks.
Default (1.0).
!_ PLOT.Yratio real aspect ratio of the ICM plot frame. Using link option of the plotcommand is equivalent to setting this variable to 1.0. If PLOT.Yratio is set to 0. , the ratio will be set automatically to fill out the available box optimally.
Default (0.8).
!_ PLOT.logo logical switch for the ICM-logo on the plot.
Default ( yes ).
!_ PLOT.color logical to generate a color plot. Usually it does not make sense to switch it off because your b/w printer will interpret the color postscript just fine anyway.
!_ PLOT.orientation preference for the plot orientation. Currently inactive. Default ( yes ).
!_ PLOT.seriesLabels preference to indicate position of a series/color legend inside the plot frame. You can provide individual names for each series in the optional string array argument of the plotcommand. (e.g. plot M_XY1Y2 {"Title","X","Y","Ser 1","Ser 2"}) Available choices:
- 1 = "none"
- 2 = "right" <- default choice
- 3 = "left"
- 4 = "top"
- 5 = "bottom"
!_ PLOT.font preference for the title/legend font. The font size can only be redefined by editing the *.eps file (search for the number before the scalefont string). Available choices:
- 1 = "Times-Bold"
- 2 = "Times-Roman" <- default choice
- 3 = "Helvetica"
- 4 = "Courier"
- 5 = "Symbol"
!_ PLOT.labelFont preference for the data point label font. You can also redefine the font size with the PLOT.fontSize variable. Available choices:
- 1 = "Times-Bold"
- 2 = "Times-Roman" <- default choice
- 3 = "Helvetica"
- 4 = "Courier"
- 5 = "Symbol"
!_ PLOT.rainbowStyle preference defining the color spectrum used by the plot area command. This command lets you plot a function of 2 arguments and show the function value by color. By default the plot command uses the minimal and maximal values of the provided matrix. You can enforce the range with the color option. Available choices:
- 1 = "black/white"
- 2 = "blue/white/red" <- default choice
- 3 = "blue/rainbow/red"
Example:
 read matrix  # def.mat is the default one
 PLOT.rainbowStyle=1
 plot area def display   # grey-scale, automatical min and max
 PLOT.rainbowStyle=3
 plot area def color={-10.,0.} display  # enforce new range
 PLOT.rainbowStyle=2
 plot area def transparent={-2.,8.} display
# low values - blue, middle [-2.,8.] - invisible, large red
!_ PLOT.box rarray of the origin and relative sizes of the ICM plot frame: { X_origin, Y_origin, X_size, Y_size }. Box {0. 0. 1. 1.} fits the page optimally.
Default ({0. 0. 1. 1.}).
2.18.13 SITE | [Top] |
[ SITE.defSelect | SITE.labelOffset | SITE.labelStyle | SITE.labelWrap | SITE.showSeqSkip ]
This table contains parameters and preferences used to display the sites, or important residues.!_ SITE.defSelect string of significant site types (shown as one letter abbreviations) Sequence identity in the alignment positions which have one of those sites is additionally rewarded in the alignment score calculation.
Default: "ABFGLMstepm"
!_ SITE.labelOffset (default 5. A) the real offset of the site label with respect to the residue label atom.
!_ SITE.labelStyle the style preference of the displayed site information:
- "none"
- "symbol" # one letter symbol, see site .
- "TYPE" # <–– default choice
- "RES.TYPE"
- "comment"
- "full"
!_ SITE.labelWrap 0.5 (inactive)
!_ SITE.showSeqSkip the string of the site types skipped in the show sequence (or alignment) commands.
2.18.14 WEBLINK | [Top] |
SP %s "http://www.aaa?%s" will be transformed into the <a href="http://www.aaa?IL2_HUMAN">IL2_HUMAN</a> link. If %Ns specification is used, only N characters of the argument string will be retain in the link. For example,
PDB %s "http://www.pdb?%4s" and 1xyz_a15_25 (specifying chain and residue range) will be translated into
<a href="http://www.pdb?1xyz">1xyz</a>_a15_25 which in your browser will look like this:
"AUTO" is another type which can be used in the link S_ "TYPE" ... expression. In this case the DB type is automatically recognized according the database reference string pattern (see also WEBAUTOLINK). An example table:
#>T WEBLINK
#>-DB------DR--LINK-------
 PDB     %s  http://www3.ncbi.nlm.nih.gov/htbin-post/Entrez/query?db=s&form=6&uid=pdb|%4s|&Dopt=g
 NCBI    g%s http://www3.ncbi.nlm.nih.gov/htbin-post/Entrez/query?db=s&form=6&uid=%s&Dopt=g
 EMBL    %s  http://www3.ncbi.nlm.nih.gov/htbin-post/Entrez/query?db=s&form=6&uid=emb|%s|&Dopt=g
 SP      %s  http://www3.ncbi.nlm.nih.gov/htbin-post/Entrez/query?db=s&form=6&uid=sp||%s&Dopt=g
 SPA     %s  http://www3.ncbi.nlm.nih.gov/htbin-post/Entrez/query?db=s&form=6&uid=sp|%s|&Dopt=g
 PROSITE %s  http://saturn.med.nyu.edu/srs/srsc?[PROSITE-acc:%s]
 MED     %s  http://www3.ncbi.nlm.nih.gov/htbin-post/Entrez/query?db=m&form=6&uid=%s&dopt=r
Example:
 read table "seqcomp.tab"  #contains references to different databases
 web SR link SR.NA1 "PDB" SR.NA2 "AUTO"
2.18.15 WEBAUTOLINK | [Top] |
Example:
 read table "seqcomp.tab"  #contains references to different databases
 web SR link SR.NA1 "AUTO" SR.NA2 "AUTO"
| Prev xrMethod | Home Up | Next rn15 |