| Prev | ICM User's Guide 22.6 Ligand Binding Pocket Analysis Examples | Next |
[ Ligand Pocket | Pocket Conservation | Displaying Key Hydrogen Bonds ]
The examples covered here include:
Displaying only the residues that surround the ligand binding pocket.
Displaying sequence conservation around the ligand binding pocket
Displaying hydrogen bonds between a ligand and the receptor
22.6.1 Displaying only the residues that surround the ligand binding pocket. |
There is a quick and easy way to do this as described in the Tips section of the manual entitled "Quick Binding Pocket Display" or you may want to follow the instructions below for a more user-defined method.
- Double click on the ligand name in the ICM workspace and it will be highlighted in blue.
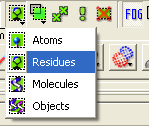
- Right click on the name and select the Neighbors option.
- Enter 6� (or whatever distance is appropriate for the ligand) for the sphere radius selection. Green crosses represent selected residues.
- Select type from the drop down menu "same_object_other_chains".
- Convert your selection to a residue selection if you wish using the button shown in the example below.
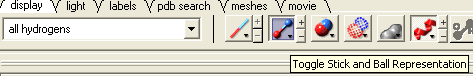
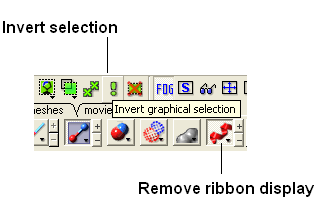
- Go to the display tab and select the representation you would like for the residues surrounding the pocket. Next use the "Invert Graphical Selection" button to select everything else other than the residues around the pocket and undisplay them by clicking on the representation buttons in the display tab.
- Select the residues around the pocket using the spherical selection method as described above.
- Select the xstick representation button in the display panel
- Select the invert selection button
- Select the ribbon display button and the ribbon display will be removed from outside the pocket.
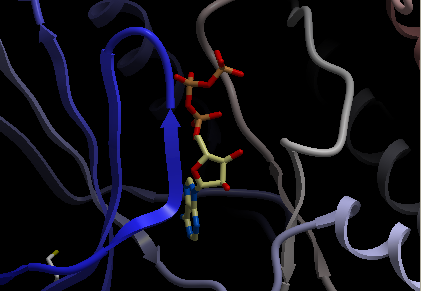
Steps shown graphically below for the kinase 1ql6 and the atp ligand.
Step 1: Receptor (1ql6.a) is in ribbon display:
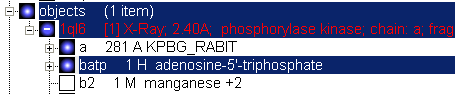
Step 2: Double click and select the atp molecule in the ICM Workspace
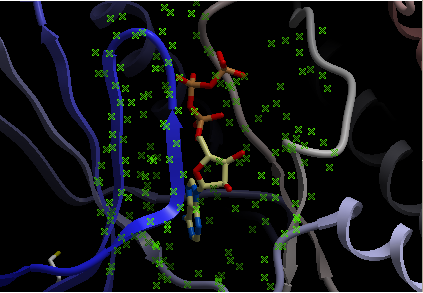
Step 3: Right click on the selected atp molecule in the ICM Workspace and select Neighbors. Enter radius and type of selection. Click OK and you will see a graphical selection of green crosses around the pocket.
Step 4: Convert your selection to a residue selection if you wish. You will then see green "R" in the graphical selection rather than green crosses.
Step 5: Select the xstick representation and the residues around the ligand will be displayed.
Step:6: If you want to undisplay the rest of the receptor outside the pocket use the invert selection button and then click the ribbon representation button.
22.6.2 Displaying the sequence conservation around the ligand binding site. |
Here is an example on how to superimpose the structures of two proteins and display the sequence conservation around the ligand binding pocket.
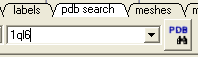
PDB Search
- PDB Search Tab 1ql6
- PDB Search Tab 1ian
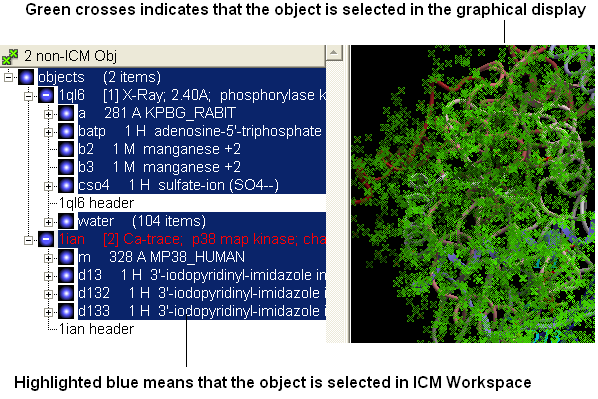
- Select both receptors by double clicking on the name of the receptor in the ICM Workspace. To select two receptors use the Ctrl button or use the shift button to select a range of objects in the ICM Workspace. A receptor which is selected will be highlighted in blue in the ICM Workspace and with green crosses in the graphical display.
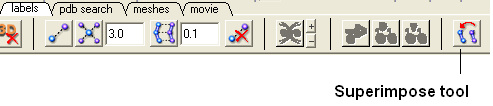
- Superimpose both structures by clicking on the display tab and selecting the superimpose button.
- Now that the structures are superimposed we can unselect everything - to do this right click and drag in blank space in the graphical display or double click in white space in the ICM Workspace or use the unselect button green box with red cross through it.
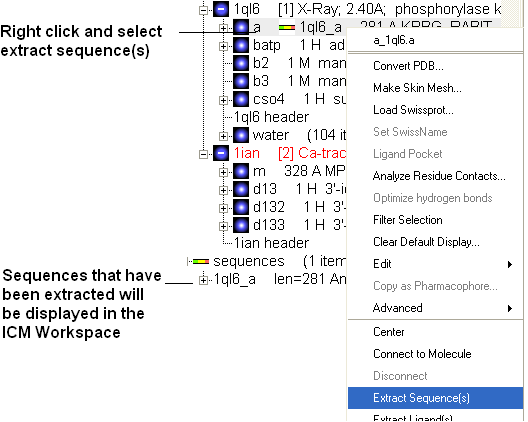
- Now extract the sequence information from each protein. To do this right click on the molecule "a" of 1ql6 and molecule "m" of 1ian. and select extract sequences. Once the sequences have been extracted you should see the sequence in the ICM Workspace entitled 1ql6_a and 1ian_m
- Now align the sequences by selecting both sequences right clicking and selecting Align sequences. An alignment will be displayed at the bottom of the graphical user interface.
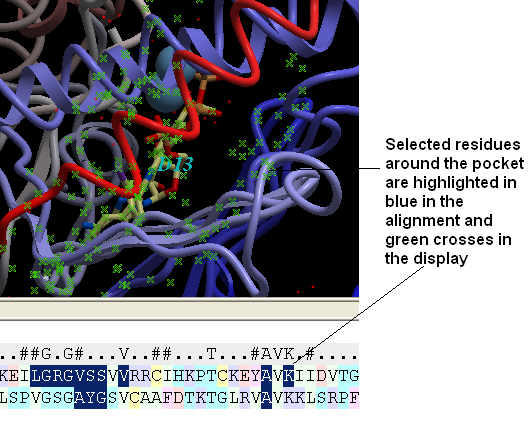
- Next we need to select the ligand ATP and select a sphere of residues around the ligand. To do this double click on the ATP molecule in 1ql6 (batp) in the ICM Workspace. You should see green crosses in the graphical display. Right click on the ATP molecule in the ICM Workspace and select neighbors. Enter a value of 6A for the radius. Select all_objects for the type of selection. Click ok and you should see a cluster of green crosses in the two proteins around the ligand and selected residues will be highlighted in blue in the alignment.
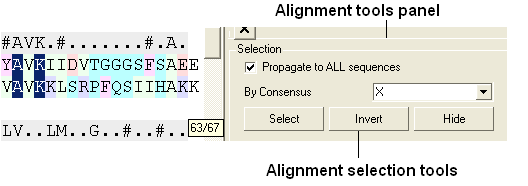
- Right click in white space in the alignment and select display tools panel.
- In the alignment tools panel select propogate to all sequences.
- Select the "invert" button to invert the current selection.
- Select the "hide" button to hide the current selection and you will be left with the residues surrounding the binding pocket in the alignment.
| NOTE: Please note that all alignments are linked with structure therefore selections can be made in the alignment. Also as an example structure can be colored according to the color in the alignment which is useful for identifying conserved regions. |
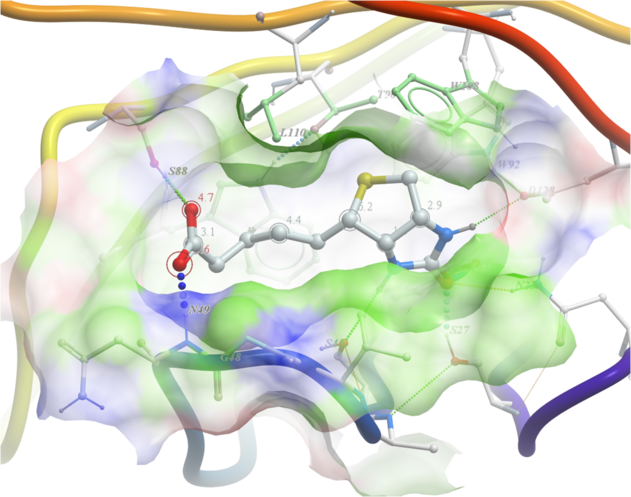
22.6.3 Displaying hydrogen bonds between a ligand and receptor. |
| NOTE: The method by which hydrogen bonds are calculated is described here in the command line manual. The GRAPHICS.hbondMinStrength parameter determines the hbond strength threshold for hbond display. The strength value is between 0. and 2. By changing 1. to 0.2 you will see more weak hydrogen bonds. |
- As an example we will use the PDB structure 1STP. Type 1STP in the pdb search tab and press return.
- In order to display energy related properties we need to convert the PDB file into an ICM object. To convert 1STP into an ICM object follow the instructions Converting a Protein into an ICM Object. In this example, the option "Replace the Original" was selected.
- Display the receptor in wire format and the ligand in xstick.
- Right click on the ligand and select "Neighbors" - Enter 3 Angstroms and Type = Visible. Do not exclude source (the ligand) therefore remove tick from box entitled "exclude source".
- Select the display tab and then select the Display H-Bond button.
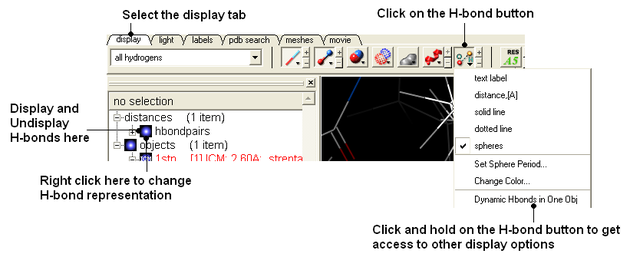
| NOTE: Different options for displaying the H-bond can be accessed by clicking and holding on the H-bond button in the "Display" tab. |
| Prev Pocket Sequence Conservation | Home Up | Next Homology Modeling |